Track site status, monitor metrics, and manage alerts in an AI-powered system built with AI to fit your infrastructure team's workflow.
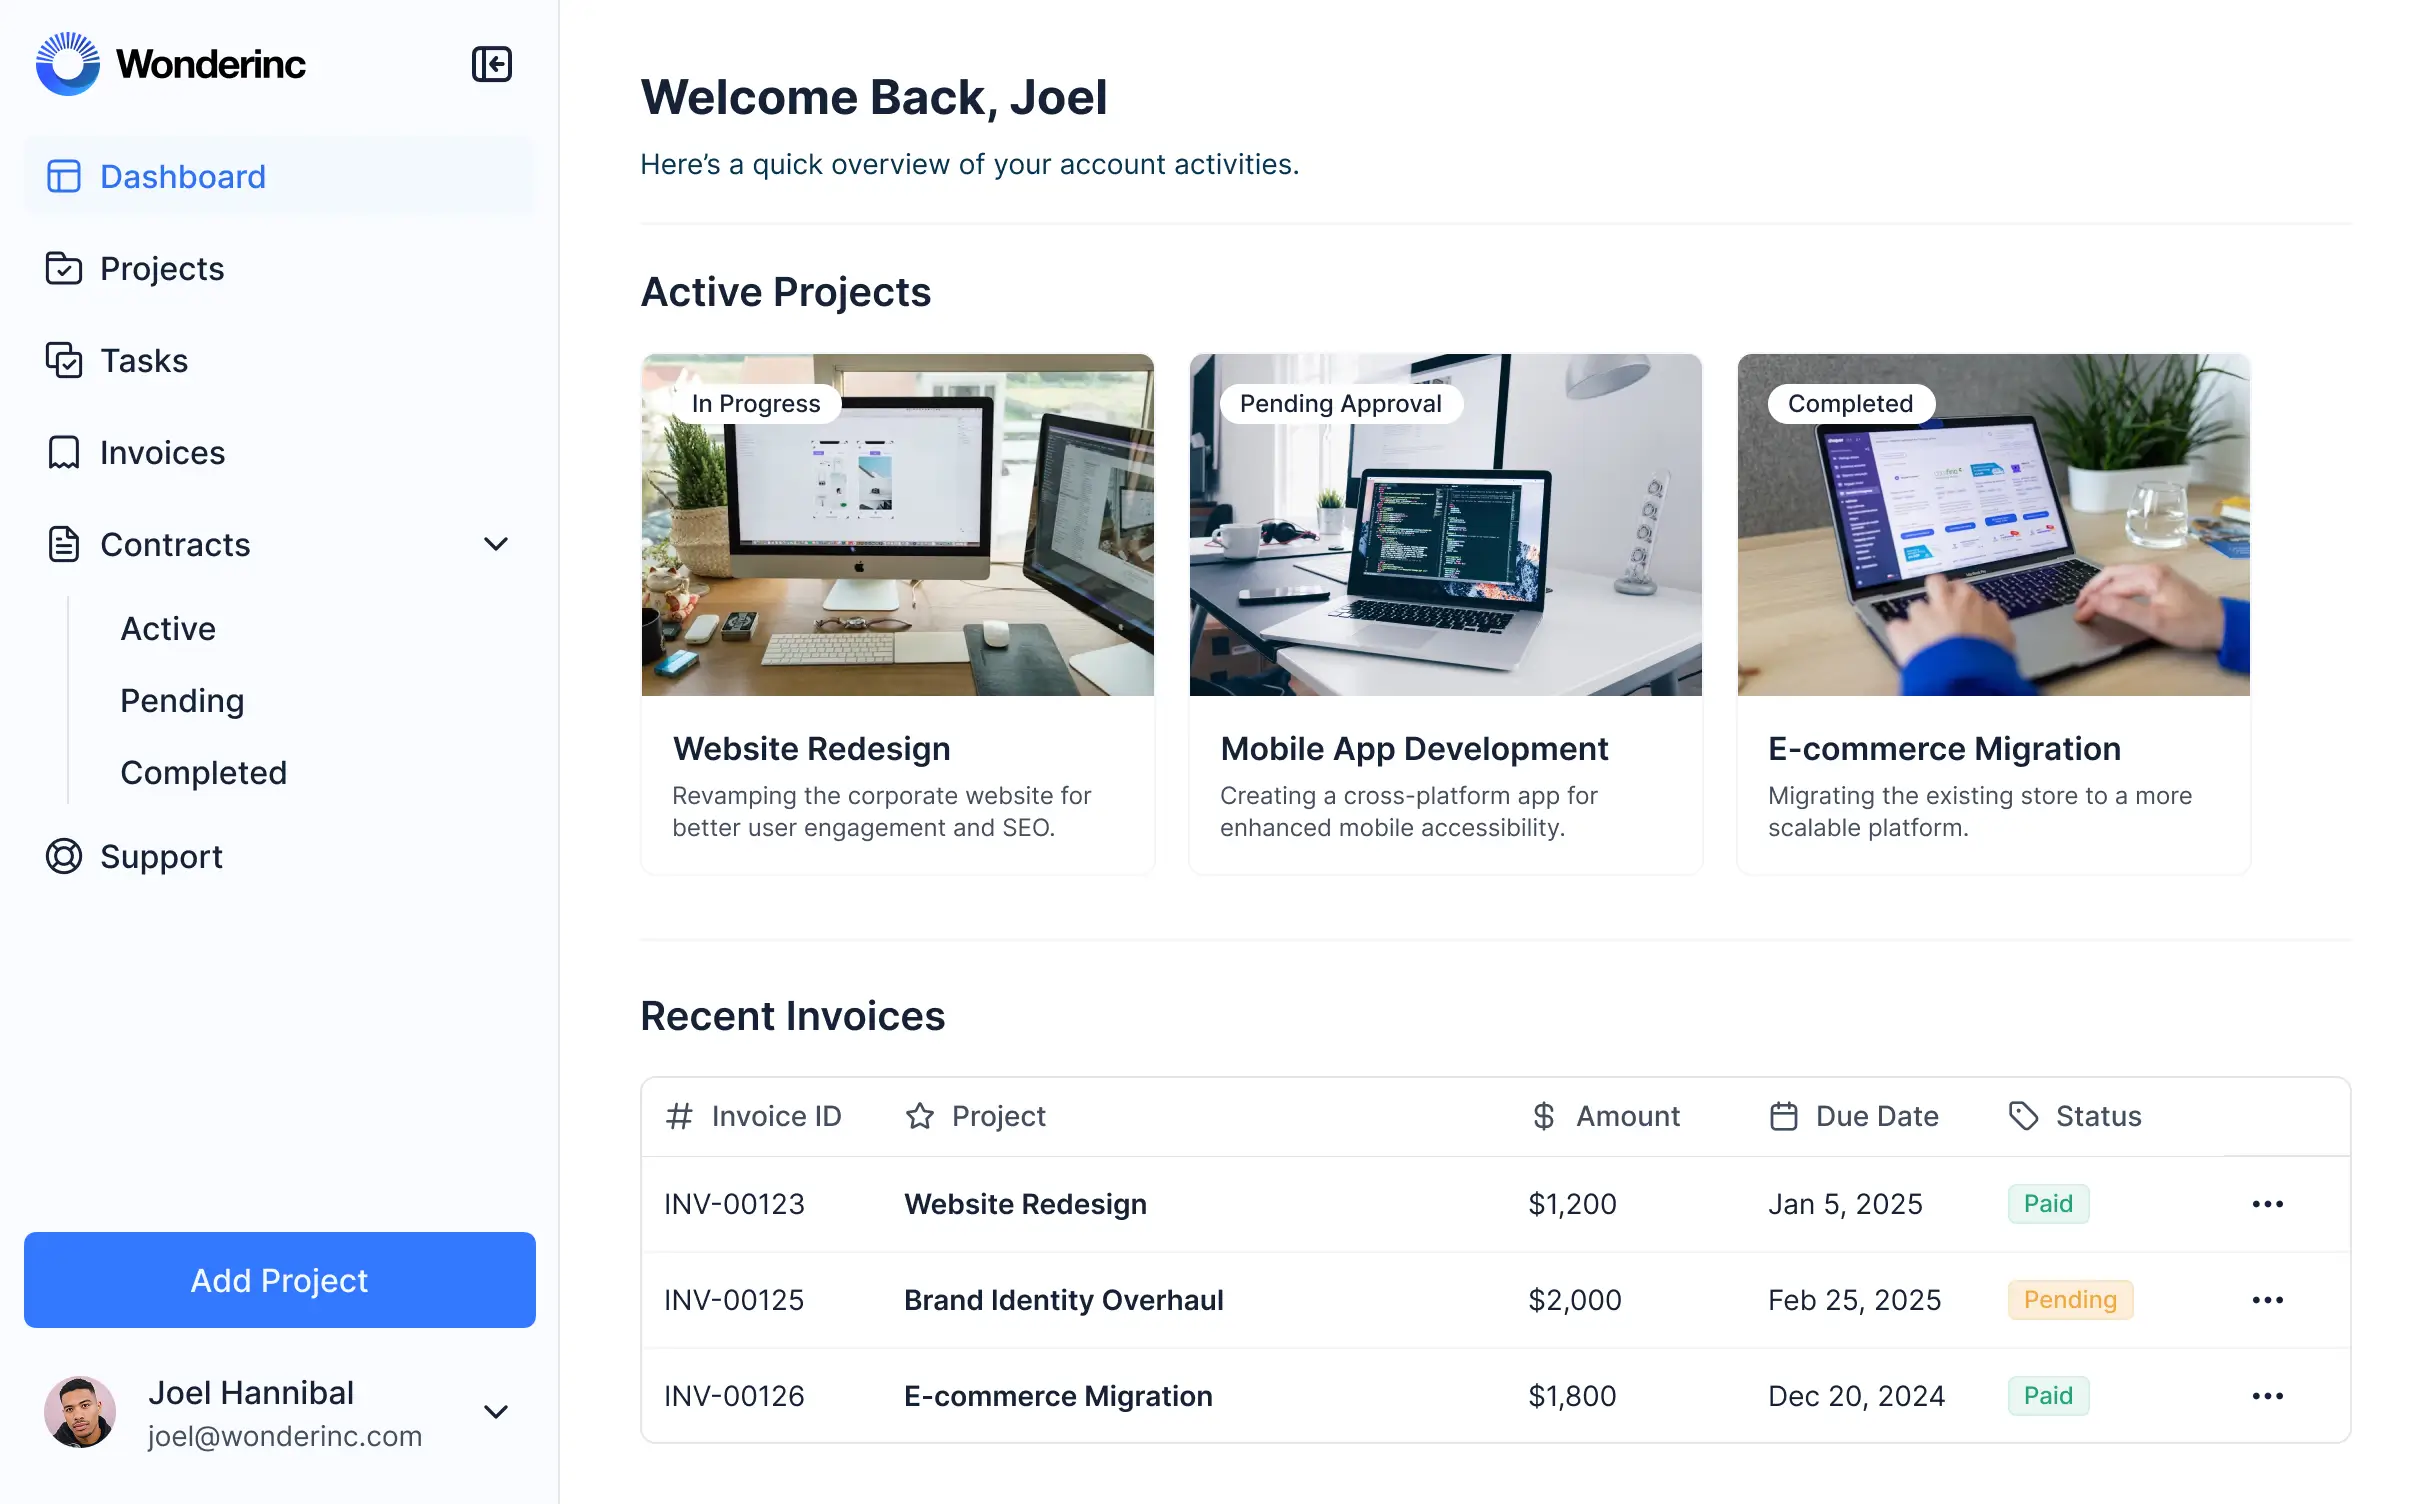



Customize your setup with the exact views and reporting your engineers need. Add features like ticket tracking as your processes grow—no code.


Connect live performance metrics, site logs, and maintenance records with real-time sync—or manage everything in Softr Databases for a single source of truth.
Give every engineer and admin the right data and access. Set up secure logins, user groups, and granular permissions—no IT tickets needed.
Give different team members tailored access and dashboards, so field techs and managers see just the network data they need.
Streamline your response with Softr Workflows. Trigger native notifications or status changes based on health check data to keep operations running.
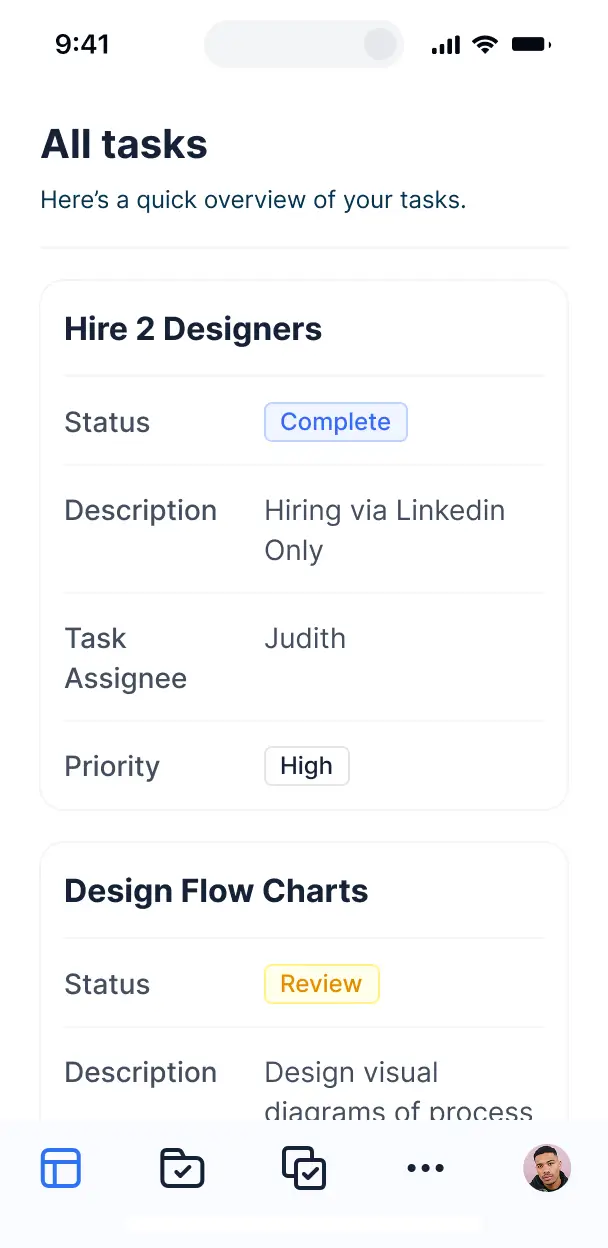
Access and update your network health check dashboard on the go via a tablet or phone. All tools are mobile-ready out of the box.
Use Google, email, or SSO logins to give your infrastructure team fast, secure access to site reliability data.
Keep infrastructure data safe with SOC2 and GDPR compliance, plus fine-tuned access control at every level of your dashboard.
No more one-size-fits-all tools or costly custom builds. Softr is easy to use and fully customizable, so you can launch faster, adapt as you grow, and skip the complexity of traditional software.

Build your network health check dashboard in minutes with AI—no manual configuration needed.

Add features like incident reporting, site documentation, or automated alerts as your infra grows.

Start with a dashboard, then add technician portals, inventory tools, or forms—all in one place.
Co-build with AI
Simply describe what you need. Let Softr handle everything - Interface, database, workflows.
Iterate with AI or visually
Control most critical parts of your app yourself - roles, permissions, security.
Ship the same day
Invite team members or external clients and partners right away. No developer handover.
Use drag-and-drop blocks to build a portal that looks sleek and modern out of the box. Add only the features you need, and iterate as your workflows evolve.




A network health check dashboard is a secure, centralized hub where IT managers and network engineers can monitor the status of their infrastructure, including servers, routers, and connectivity metrics. It consolidates real-time performance data, uptime logs, and incident reports into one view, eliminating the need to dig through fragmented logs or manual spreadsheets. This makes it easier for your technical team to maintain uptime and ensure consistent service levels across the organization.
Softr is the first AI-native platform for building business software, making it the ideal solution for creating a network health check dashboard that matches your specific infrastructure. You can describe your monitoring requirements to the AI Co-Builder to instantly generate your technical database, status pages, and notification logic—all fully connected and secure.
You don't need to be a developer to build this. You can start by generating with AI, using a pre-built IT template, or building from scratch. Everything runs on Softr Databases for high-performance logging, or you can connect external data from sources like Airtable, SQL databases, or even cloud monitoring tools via API. You have full control to customize visualizations for latency or packet loss, set granular permissions for system admins, and brand it for your IT department. It's fast to deploy, easy to scale as your network grows, and flexible enough to adapt to new hardware.
You can include a wide range of features in your network health check dashboard to streamline your IT operations. A powerful monitoring app usually combines data visualization blocks with AI-driven analysis:
- AI-Powered Intelligence – Use Ask AI to query your network logs conversationally, or set up Database AI Agents to automatically summarize system logs or identify recurring failure patterns.
- Vibe Coding Blocks – Build custom visual elements—like a dynamic network topology map or a live ping monitor—using the AI Code block to "vibe code" the exact technical interface you need.
- Softr Workflows – Build native automations (like an instant Slack alert when a server goes offline) that trigger whenever a health status changes from 'Healthy' to 'Critical'.
- User Portals & Logins – Securely manage access so that different regional engineers only see the hardware status for their specific data centers.
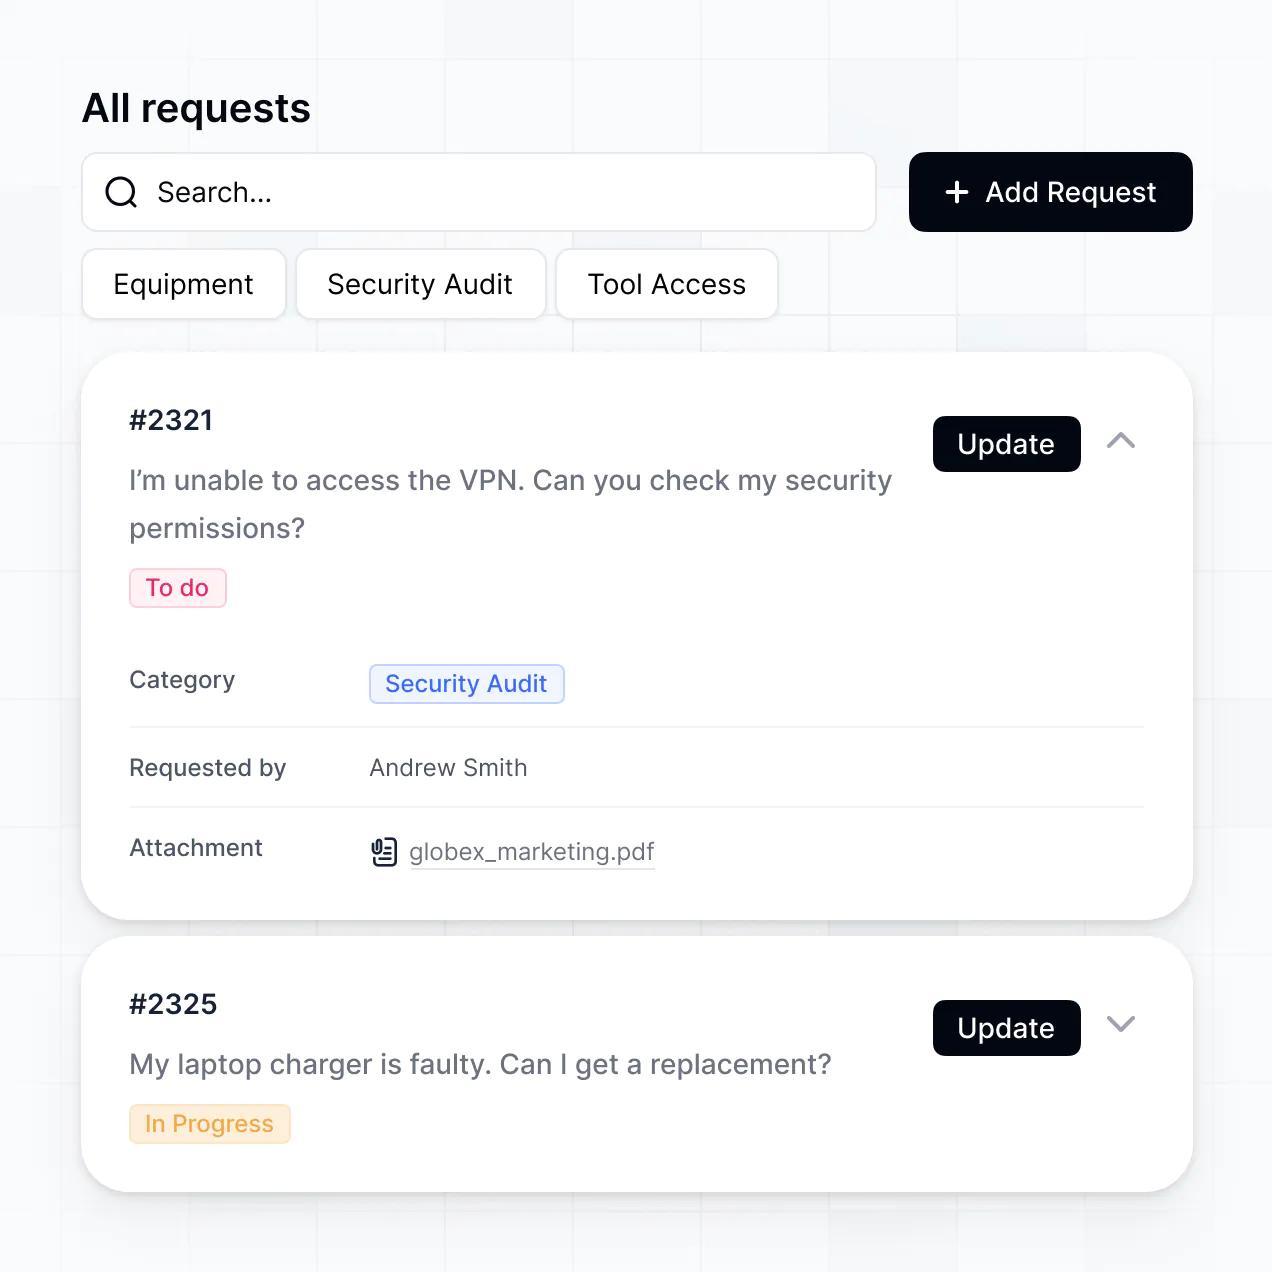
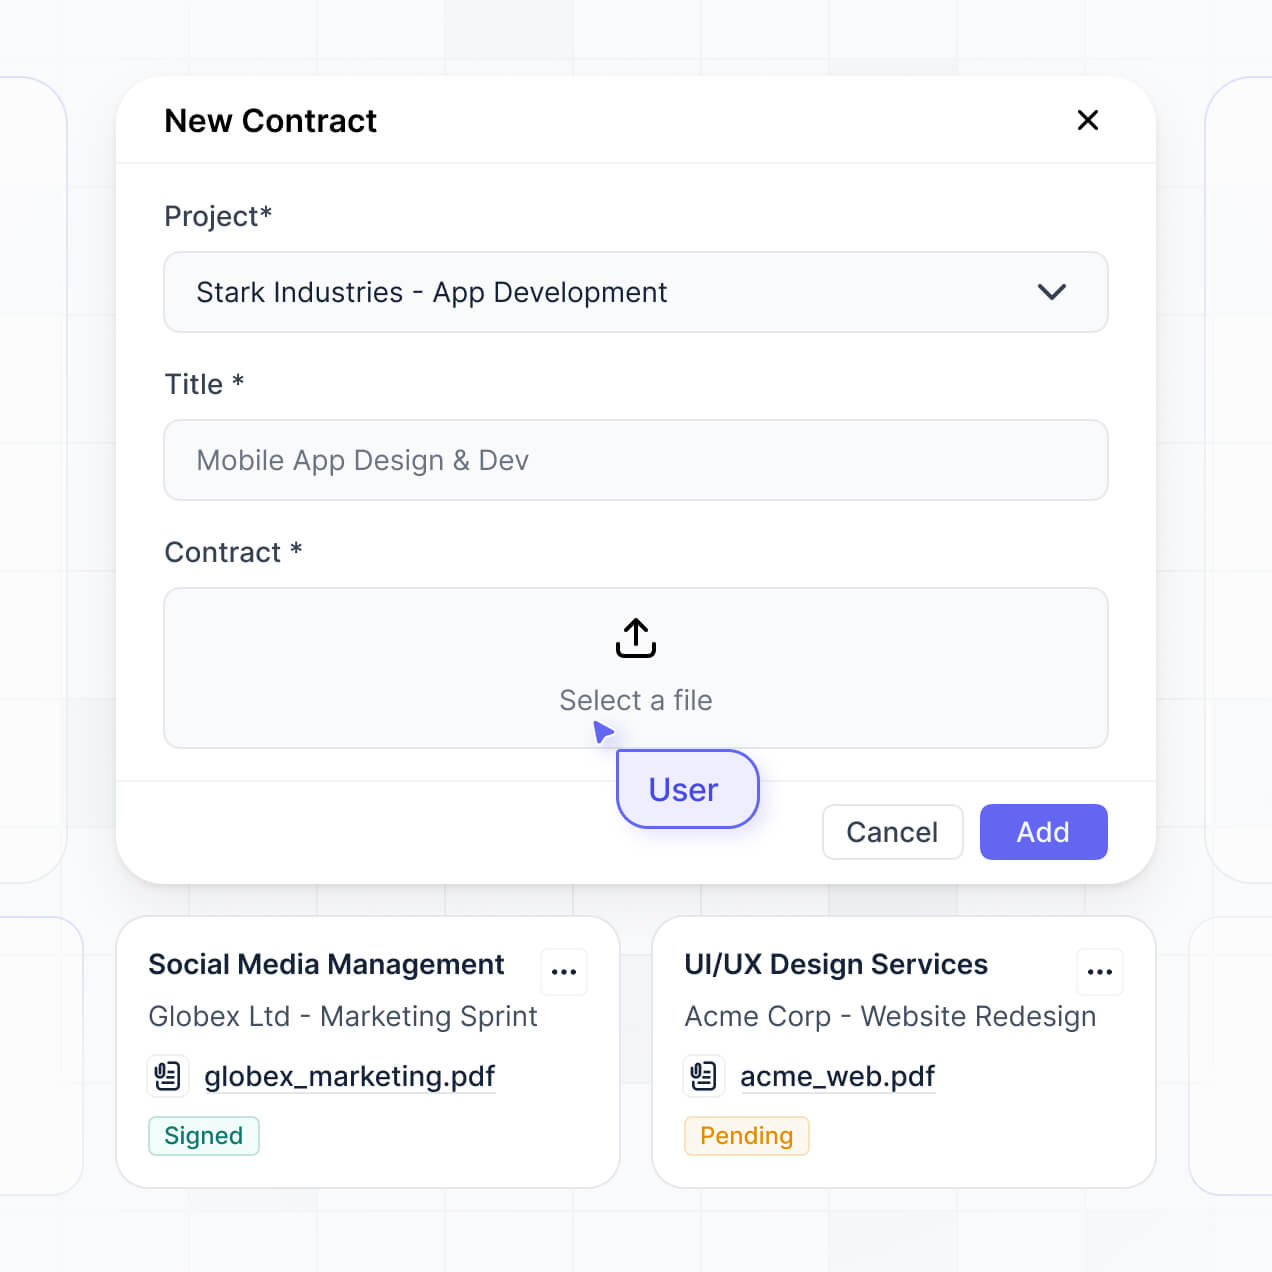
- Incident Forms – Capture field reports and maintenance logs with custom forms, including technical photos and attachments.
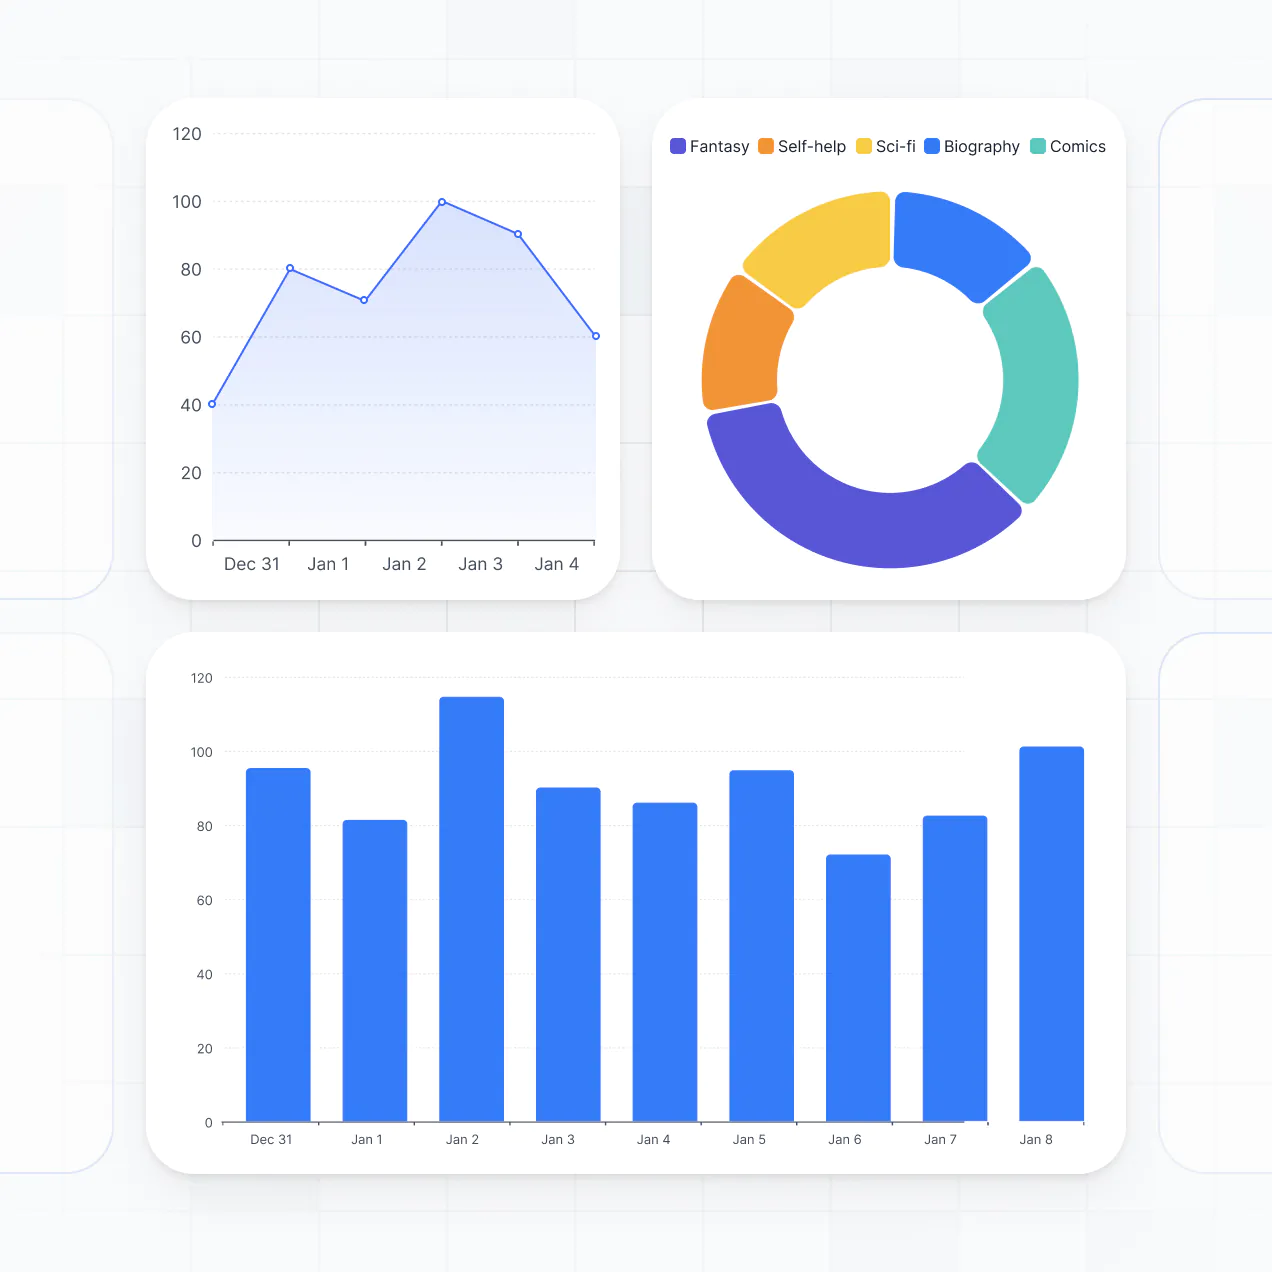
- Performance Charts – Visualize key metrics like bandwidth usage, CPU load, and response times with real-time charts.
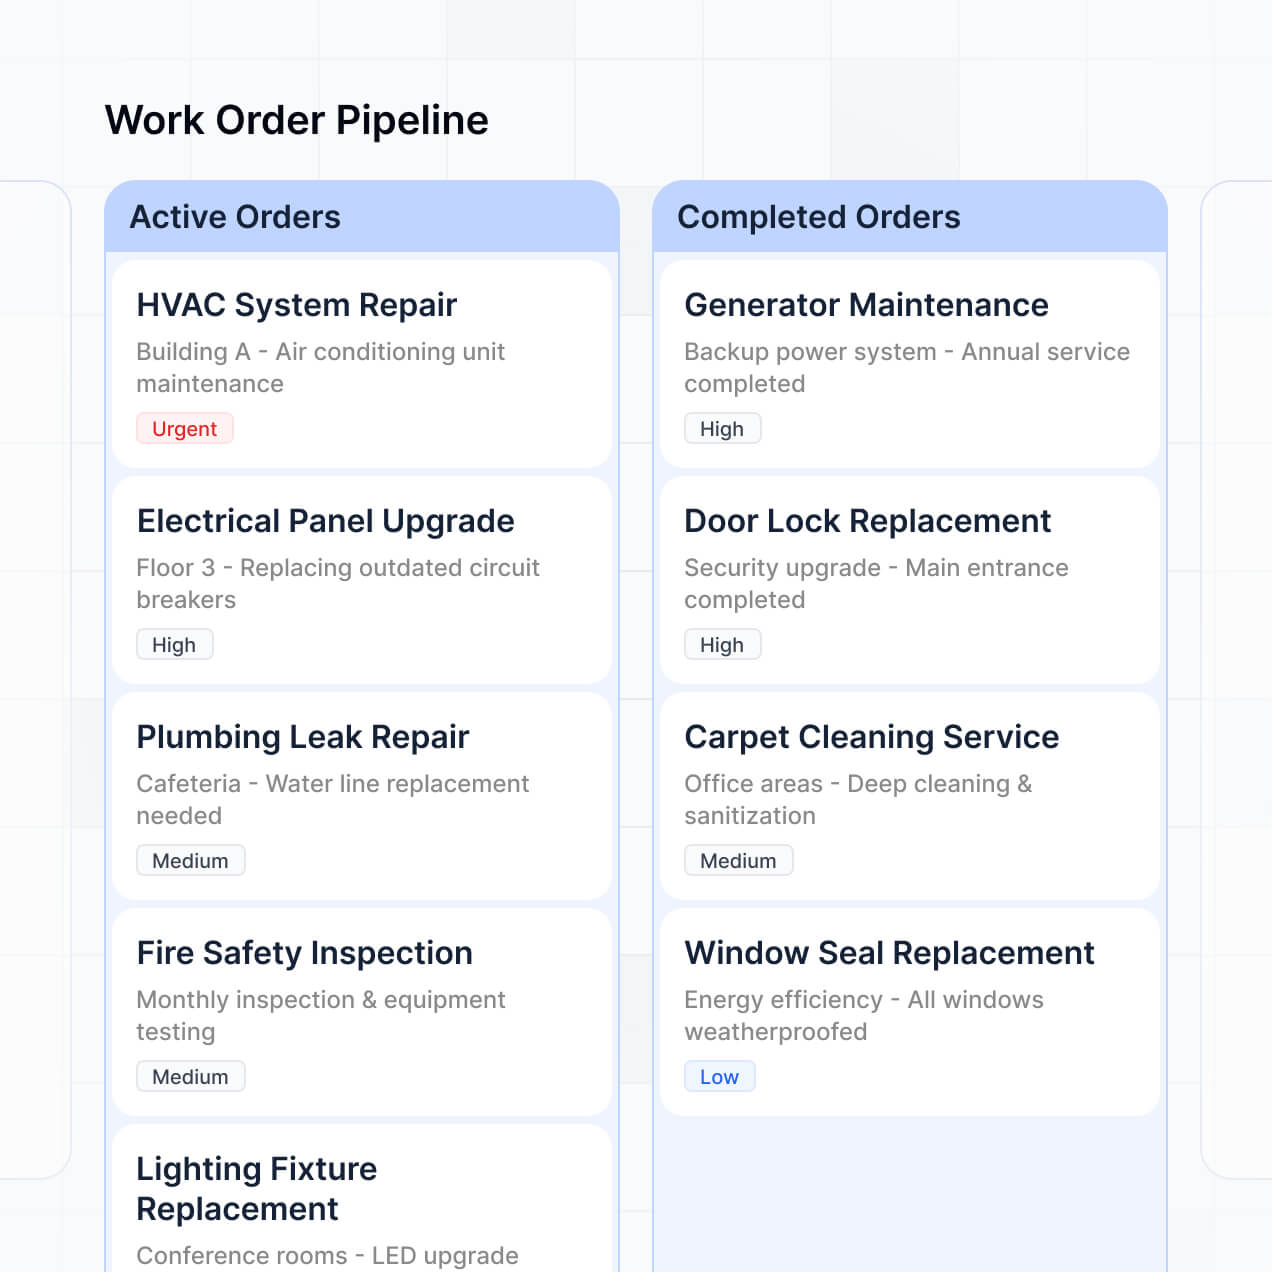
- Status Lists & Filtering – Manage your inventory with searchable tables and kanban boards to track hardware maintenance status.
Everything is built using Softr's drag-and-drop blocks, so you can create these features without coding. If you need a more specific monitoring tool, use the Vibe Coding block to generate it. As your tech stack evolves, updating your dashboard is simple.
Vibe coding is all about moving fast and using AI to build exactly what your IT team needs. You can "vibe code" a network health check dashboard in Softr by simply describing your monitoring requirements—such as 'I need a dashboard to track server uptime and fiber-link latency'—to the AI Co-Builder. Softr then generates a production-ready monitoring app on a stable, secure foundation.
Unlike other tools that generate unstable custom scripts, Softr handles the foundational aspects—like secure engineer authentication, relational database logic for device logs, and role-based security—natively. This means you get the speed of vibe coding without the technical debt of managing raw code. You describe your network requirements, Softr builds the interface, and it’s ready for your operations team instantly.
Yes. You can manage multiple regional networks or hardware teams within a single dashboard. Every engineer only sees the specific servers or network segments assigned to them, based on their secure login and role. This is particularly useful for global enterprises or managed service providers (MSPs) who need to isolate client or regional data while maintaining a master administrative view.
Yes, you can. You don't need an existing monitoring setup to start building with Softr. If you're starting from scratch, you can use Softr Databases, which is built into the platform, to log your hardware inventory, IP addresses, and maintenance schedules directly within your application.
However, if you already have network logs and device data in tools like Airtable, Google Sheets, HubSpot, or SQL databases (like PostgreSQL or MySQL), you can connect those as data sources. You can also use the REST API connector to ingest real-time data from monitoring hardware. You maintain full control over how your network architecture is structured and visualized.
Softr Databases is the recommended native data source for your dashboard. It is designed for business software, offering high performance and instant triggers for network alerts, ensuring a fast experience because the data is native to the platform.
If your network data currently sits elsewhere, Softr connects to over 17 external sources. You can pull device lists from Airtable, maintenance schedules from Google Sheets, or server logs from SQL databases and BigQuery. You can even integrate multiple sources at once—for example, pulling hardware specs from Softr Databases and live incident tickets from HubSpot. Most sources support real-time, two-way sync, keeping your dashboard updated the moment a network status changes.
Yes, Softr gives you complete control over the user experience of your network health check dashboard. You can customize the layout and technical views to match your IT department's workflow. Every page or data block can be filtered based on the user's role, so a junior technician might see a simple status list while a senior architect has full access to configuration settings.
You can define roles such as 'Viewer', 'Editor', or 'Super Admin' and set specific permissions for viewing or updating network records. For instance, field technicians can only update the status of the local hardware they are visiting. This granular control is essential for managing complex infrastructures securely and keeping the interface clean for every team member.
Yes, you can fully white-label your network health check dashboard in Softr. You can use your IT department or company logo, brand colors, and a custom domain (e.g., status.yourcompany.com) to make the dashboard feel like an official internal tool. You can remove all Softr branding so that engineers and stakeholders only see your company's professional identity during system reviews.
Yes, Softr provides extensive flexibility to control the design of your network health check dashboard. You can adjust the visual hierarchy, colors, and fonts to ensure the data is easy to read during critical outages. You choose the layout of each page and decide which metrics are prioritized for logged-in users.
To display your network data, you can use specialized blocks:
- Table blocks – for listing routers, serial numbers, and IP addresses.
- Card blocks – to highlight the status of key data centers or cloud regions.
- Detail View – to drill down into a specific server's history and logs.
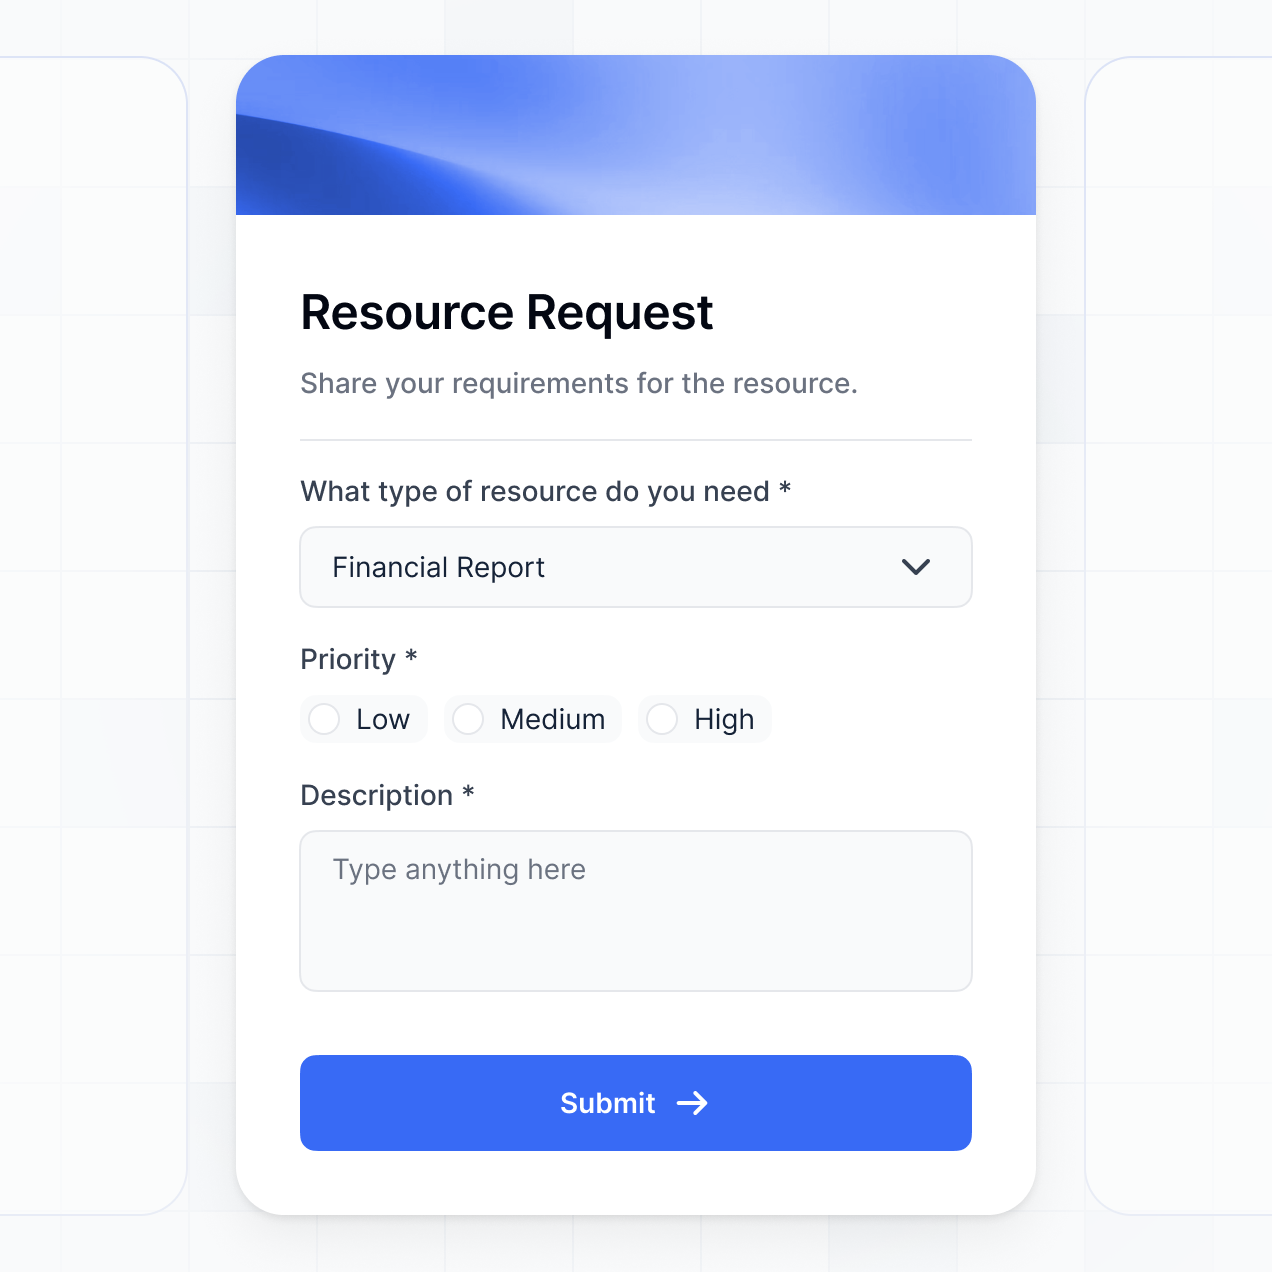
- Forms – to submit network maintenance reports or report outages.
- Charts – to visualize uptime percentages and traffic spikes.
- Calendar blocks – to track scheduled maintenance windows.
Updates are easy to make in the visual builder whenever your infrastructure evolves.
Softr is built with enterprise-grade security. All data is encrypted in transit and at rest, and your dashboard is hosted on secure infrastructure. You have granular control over data access through role-based permissions, allowing you to hide sensitive network configurations or IP addresses from unauthorized users.
For apps using Softr Databases, your information is stored in a secure EU-based environment (Germany) with SOC 2 Type II compliance. If you connect to external databases like SQL or Snowflake, Softr acts as a secure interface and does not store your sensitive underlying data. You are always in control of who can view or edit your network infrastructure details through global visibility rules.
It is fully production-ready. Unlike basic AI prototyping tools that generate 'throwaway' code, Softr builds your network dashboard on a stable, scalable foundation designed for business logic.
We handle the complex lifting—including engineer authentication, secure data fetching, and granular permissions—natively. This ensures you avoid the 'Day Two' struggle of AI tools; you get the benefit of instant generation without the risk of managing buggy, custom-coded scripts. Your dashboard is secure, reliable, and ready to monitor your traffic from day one.
Softr is the first AI-native platform specifically optimized for business apps. While traditional no-code tools require hours of manual configuration and 'vibe coding' tools produce fragile results, Softr's AI Co-Builder creates a network dashboard on top of a secure, production-grade foundation.
The difference is the hybrid approach: use AI to generate your network database and pages in minutes, then use visual controls to fine-tune the monitoring logic. You get the speed of AI with the reliability of built-in business features like SSO, role-based access, and secure hosting. It is built for IT teams who need to move from a concept to a live monitoring tool immediately.
Yes. Softr supports powerful native workflows and integrations to connect your network dashboard with the rest of your IT stack. You can automate alerts using native Softr Workflows, or connect to tools like Slack, Microsoft Teams, or PagerDuty. Softr also supports REST APIs and webhooks for advanced automated reporting.
Whether you need to trigger an incident ticket in another system when a health check fails or pull in server data from external monitoring APIs, you can build these automated connections directly into your dashboard without writing a single line of code.
Describe your requirements. Softr's AI builds your infrastructure tool in minutes. Get started free.