
Build your own network traffic monitoring system
Monitor bandwidth, track usage, and ensure security with a customizable monitoring solution tailored to your network's needs.
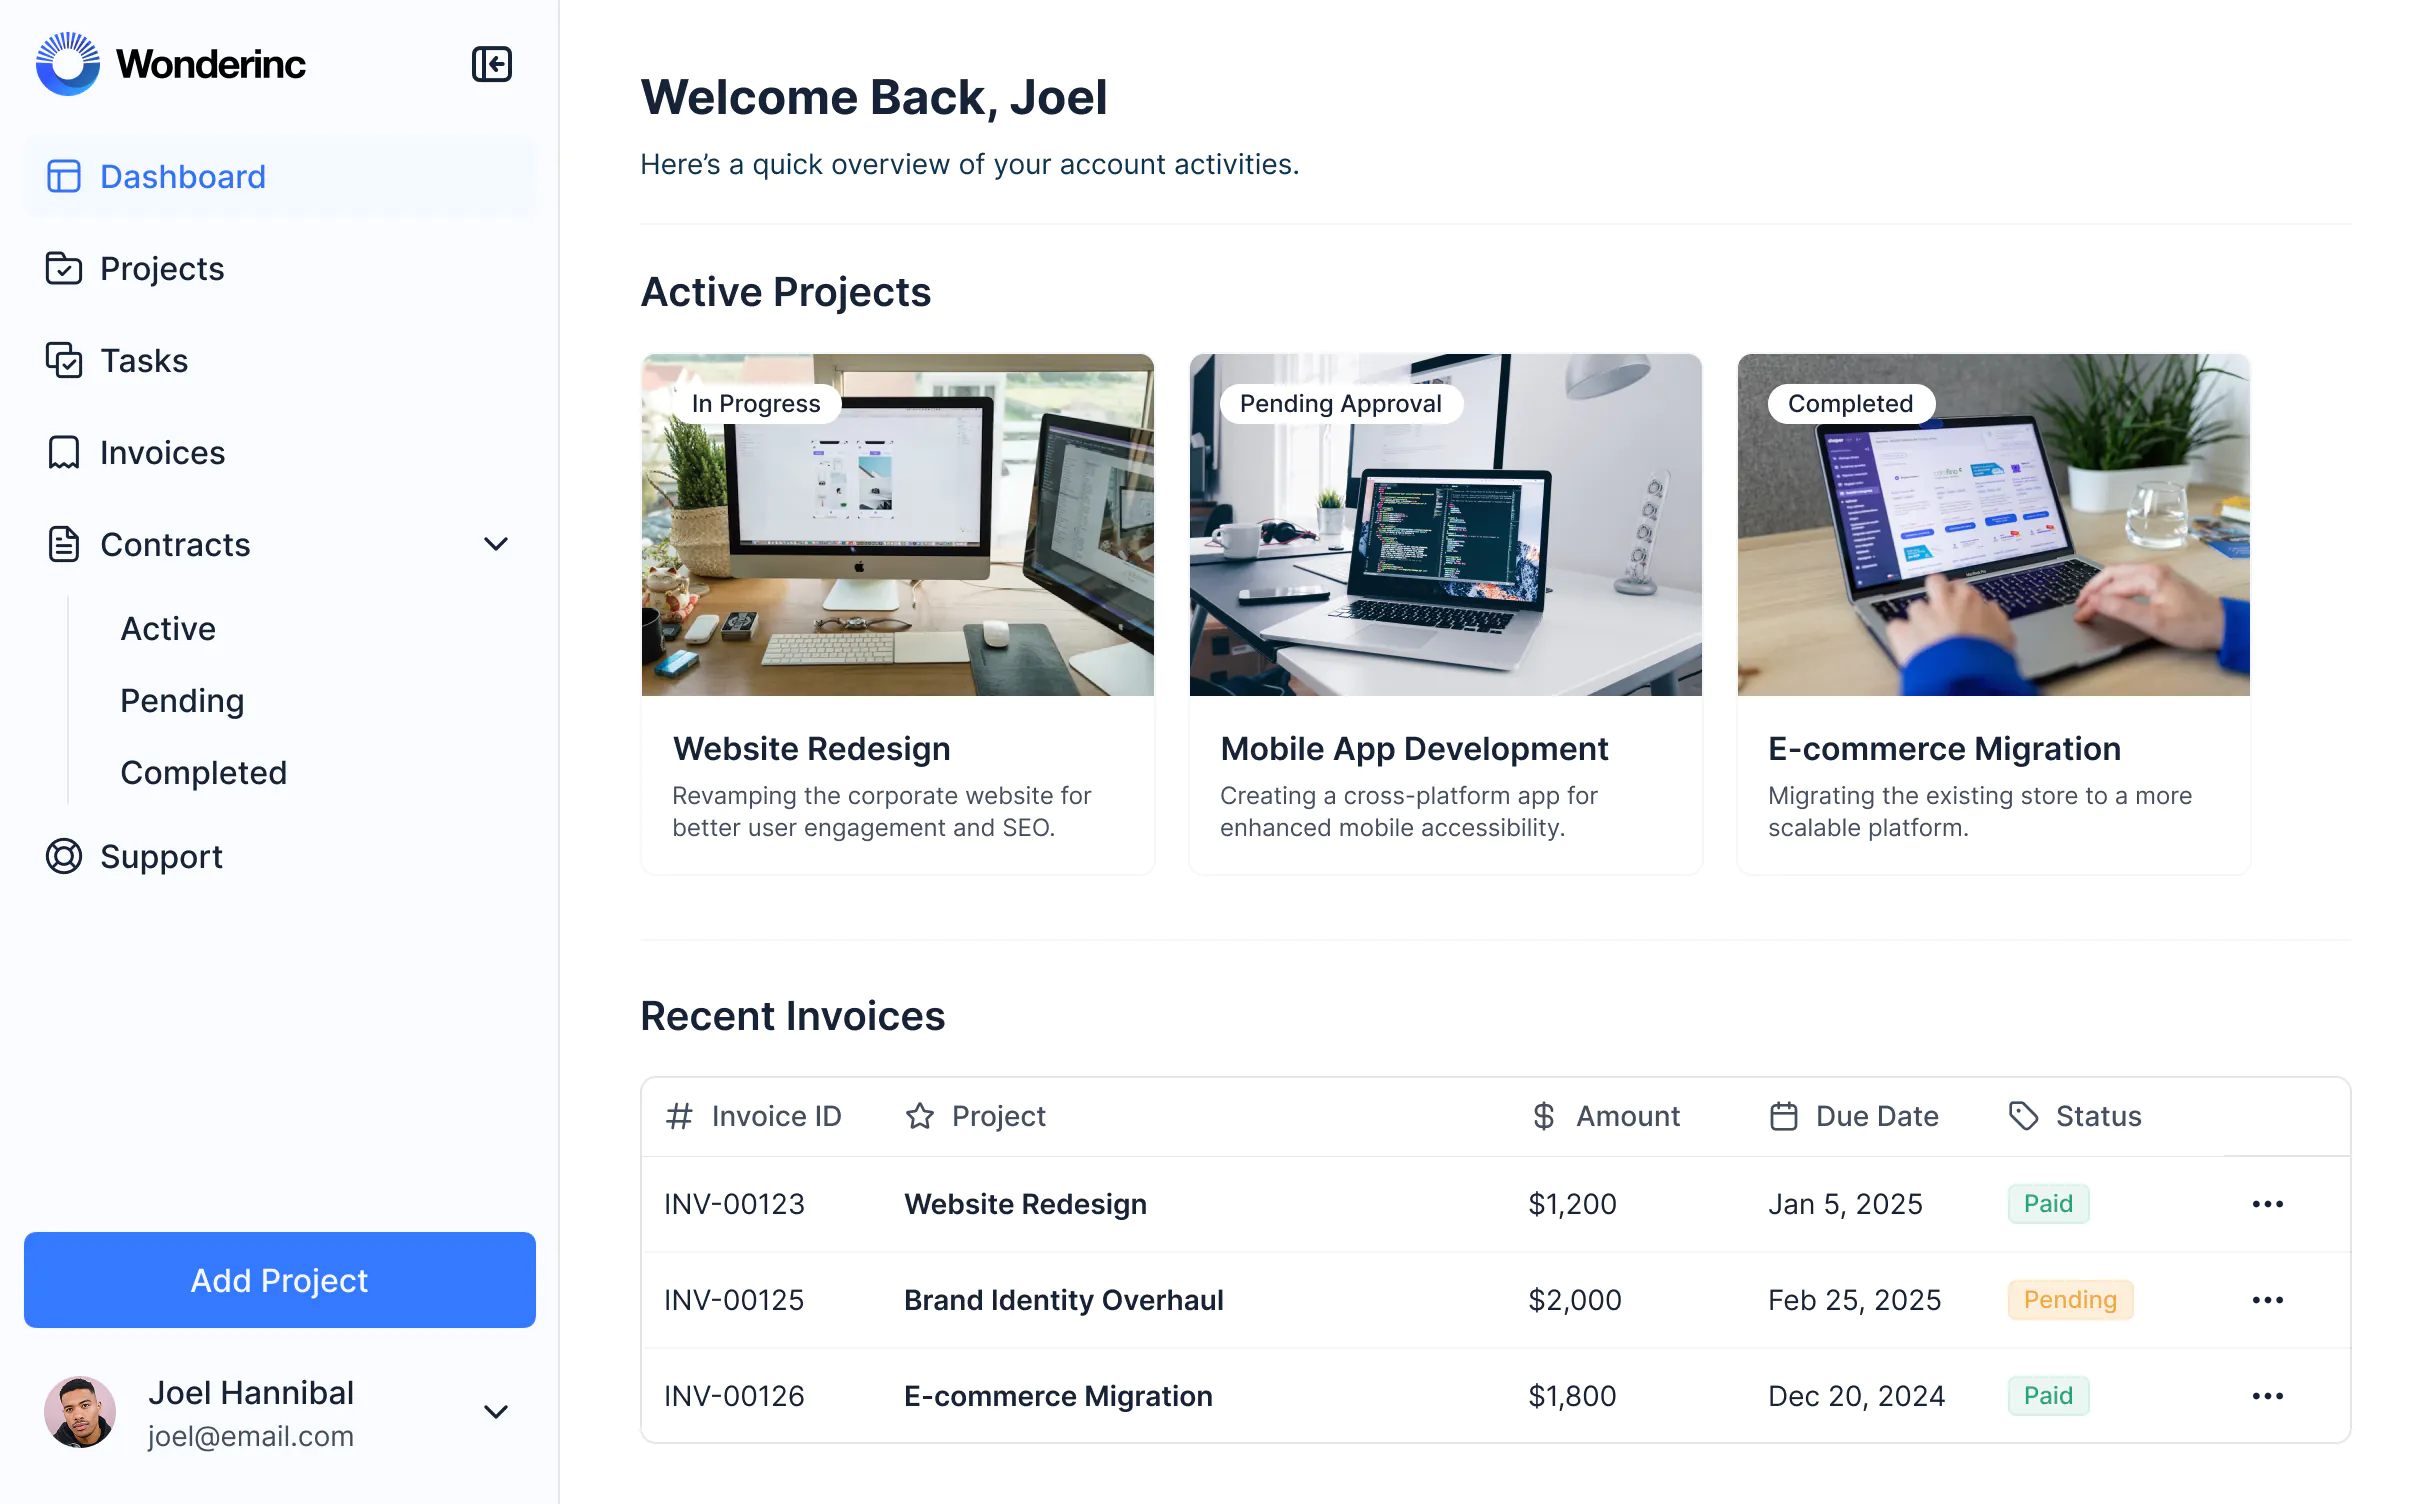
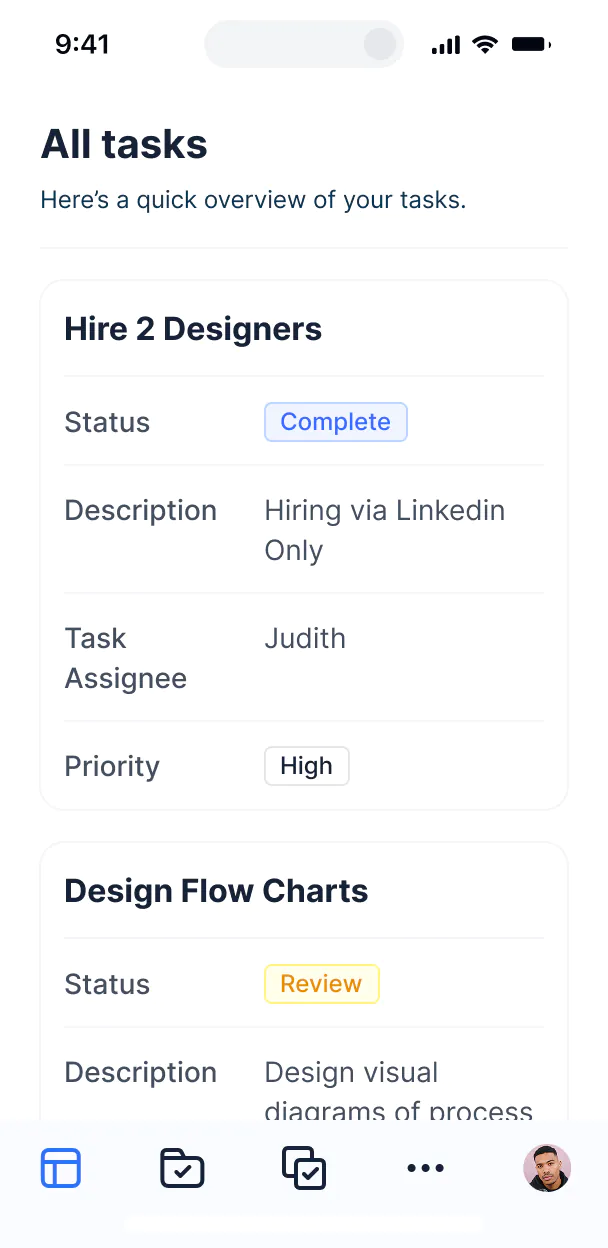


Customize your monitoring system to your needs
Set up your traffic monitoring system with only the features and workflows you require. Adapt and evolve your setup as your network grows—no code needed.
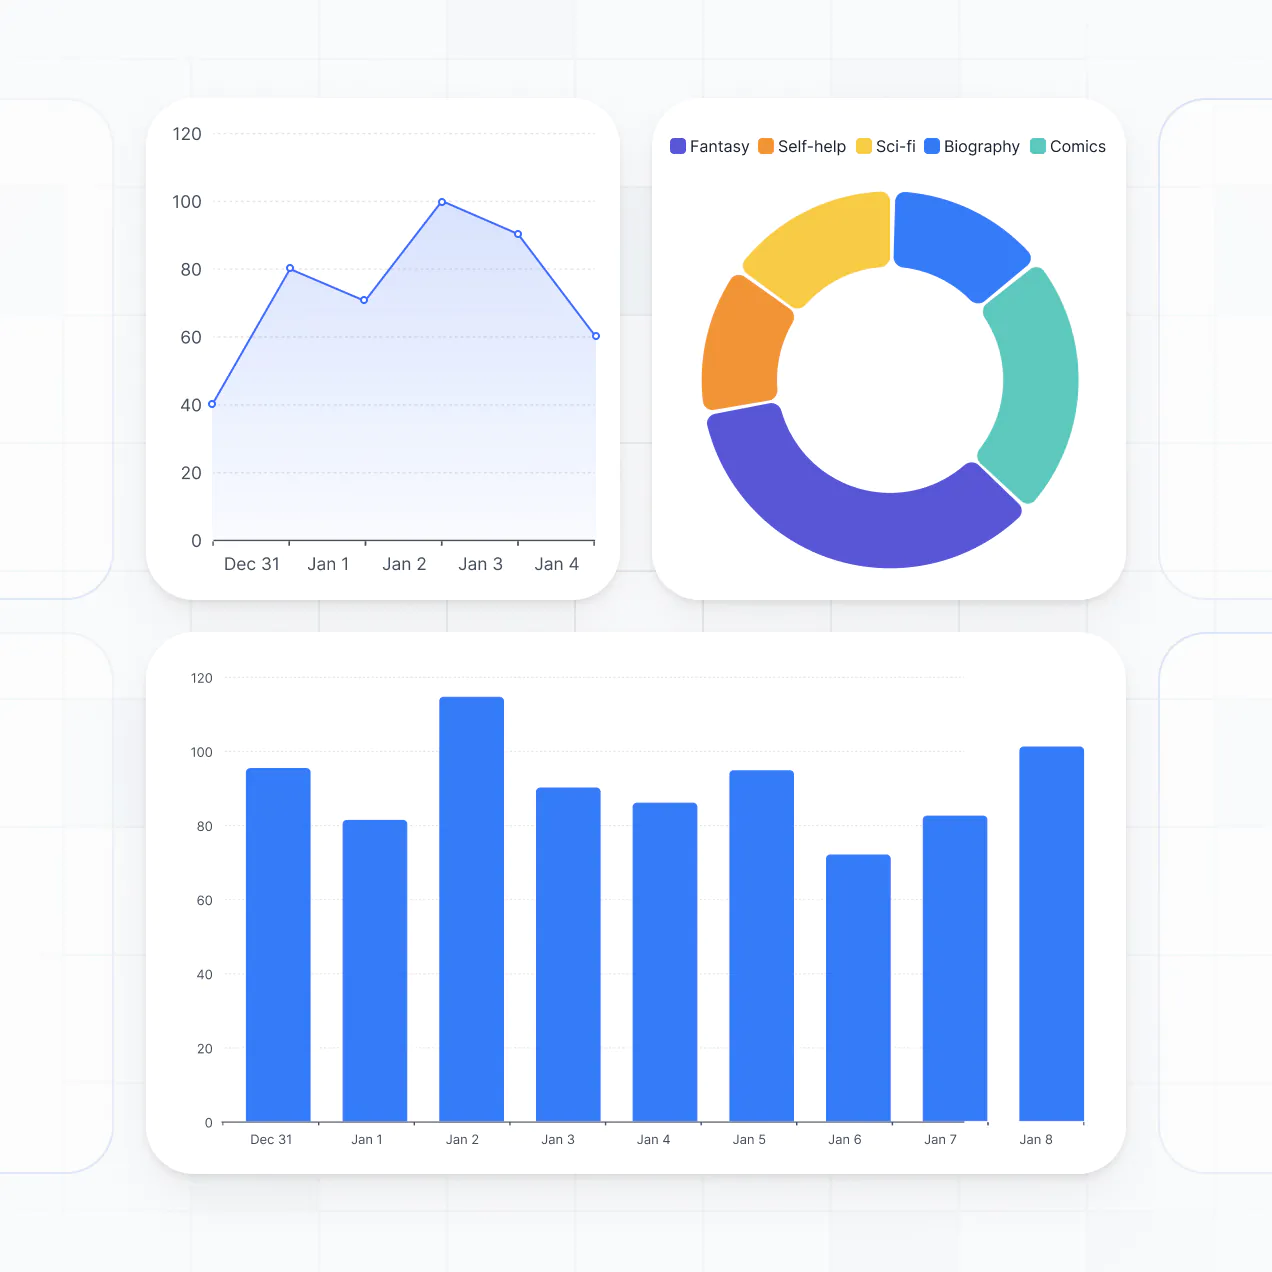

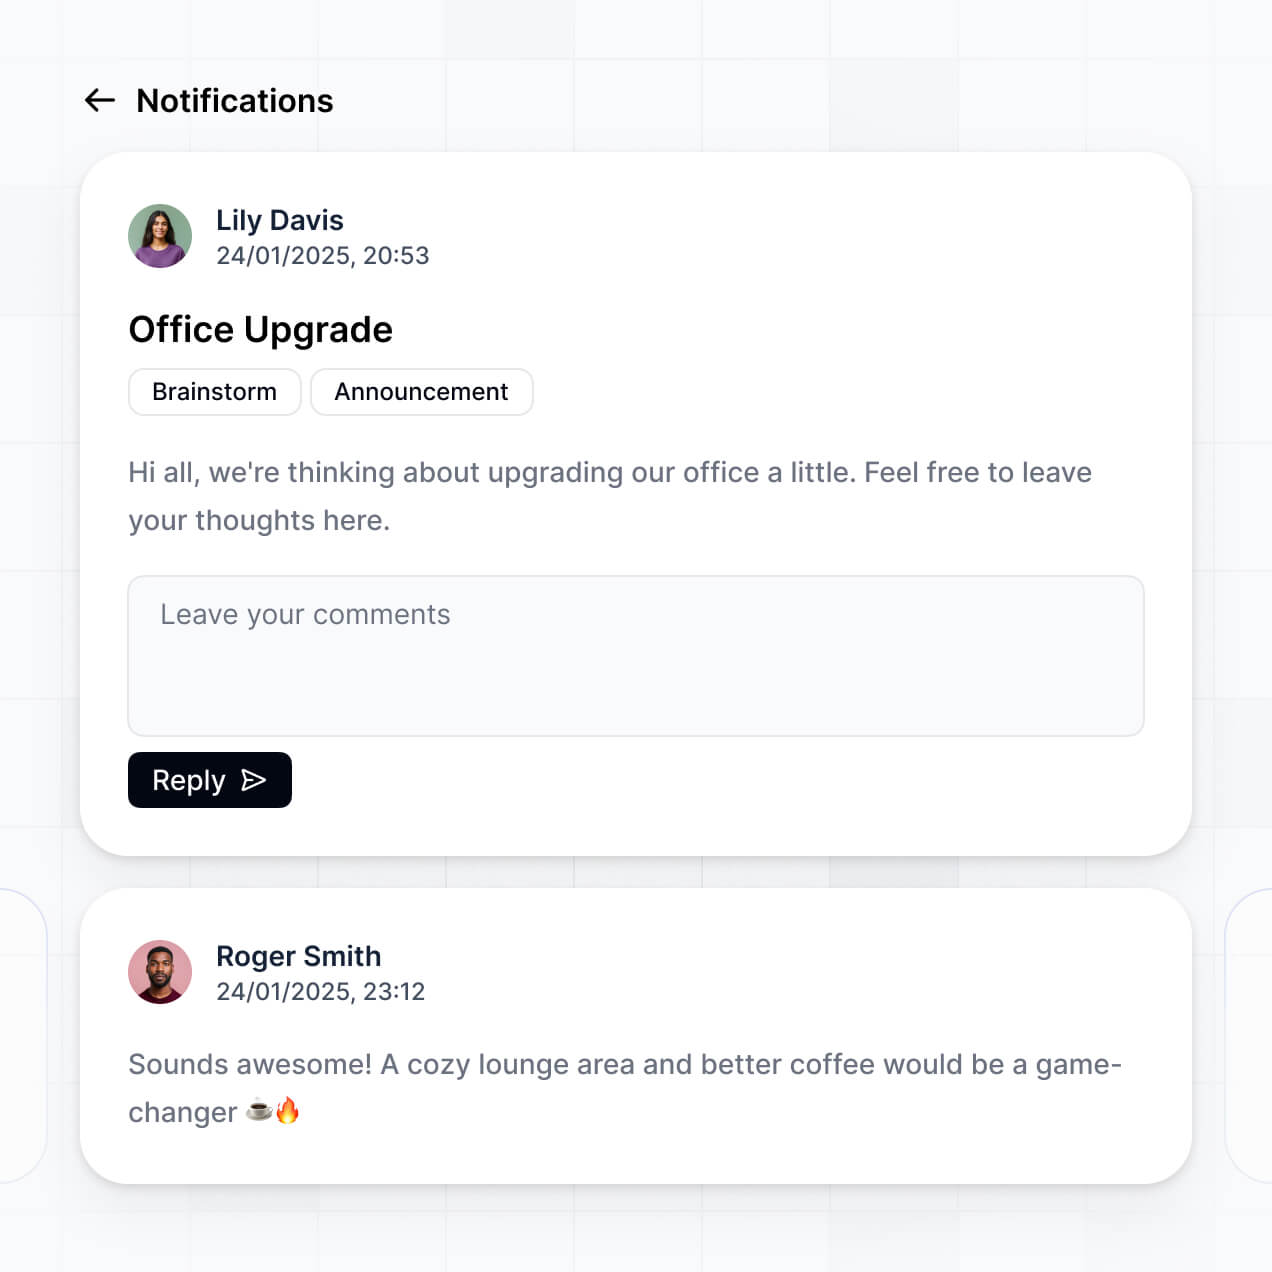


Bring all your traffic data together in real time
Connect monitoring tools, firewalls, and other systems with real-time sync—or manage everything in Softr Databases. Create a single source of truth for your network.


Custom access for every team. Built-in security, no dev time.
Empower your IT and network teams with secure dashboards and permissions. Set up tailored logins, granular access, and real-time insights—no IT support needed.
Advanced permissions
Provide network admins, analysts, or support staff with custom dashboards—each sees only the data relevant to their role.
User groups
Provide network admins, analysts, or support staff with custom dashboards—each sees only the data relevant to their role.
Automations
Integrate with monitoring tools via Make, Zapier, or N8N to automate alerting, reporting, and data syncs.
Works on any device
Monitor network traffic from desktop or mobile. Dashboards are fully responsive and ready for use anywhere.
Easy, secure logins
Allow secure team access with Google, email, or SSO logins—no IT tickets or manual provisioning required.
Security
Protect sensitive network data with SOC2 and GDPR compliance, plus robust access controls for your entire team.
.svg)
An AI assistant for IT admins
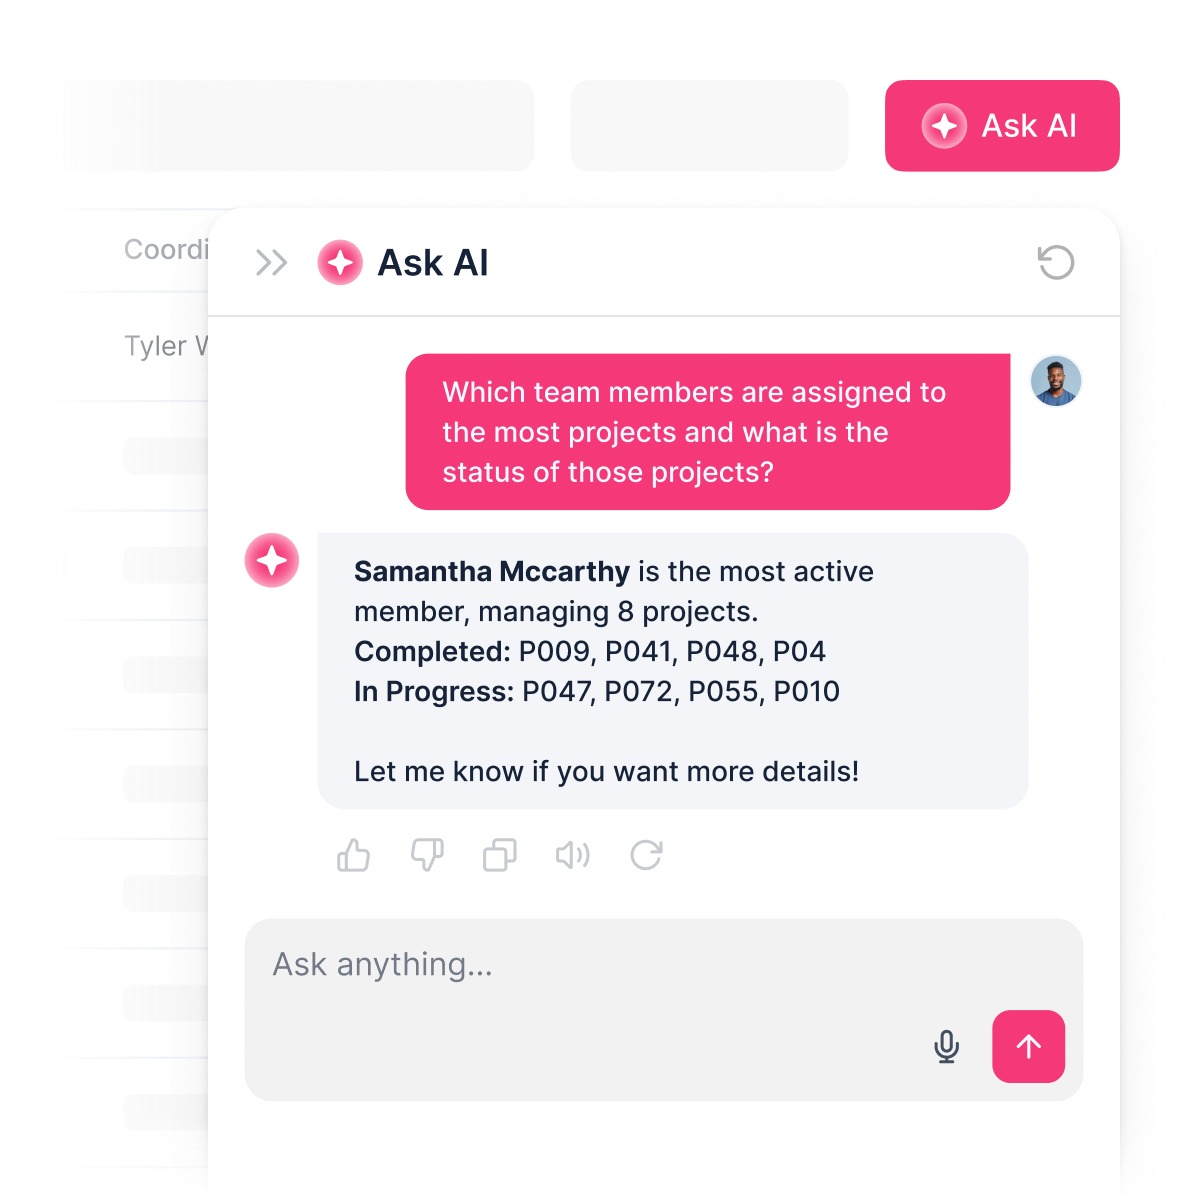
Ask AI about traffic trends or alerts—get quick, clear answers right inside your monitoring dashboard with Softr’s built-in support.

Why Softr vs other software
No more one-size-fits-all tools or costly custom builds. Softr is easy to use and fully customizable, so you can launch faster, adapt as you grow, and skip the complexity of traditional software.

Easy, fast setup
Spin up your network traffic dashboard in minutes with drag-and-drop blocks and templates.

Consolidate your stack
Add new reports, integrations, or alerting as your network monitoring needs change—no rebuilds needed.

Flexible as you grow
Monitor, analyze, and report on network activity—all in one dashboard, without extra tools or logins.

Build a fully custom network traffic monitor in minutes
Connect to your data in seconds
Integrate with your spreadsheets and databases, including Airtable, SQL, Hubspot, Google Sheets, Supabase, BigQuery, and more—in just a few clicks. Your data is always secure and in sync.
Customize layout and logic
Drag and drop customizable building blocks with various views and functionalities. Granular permissions allow you to control what data each user can access, and which actions they can take.
Publish and launch
Ship applications that your team will love in minutes or hours, instead of days or weeks. Deploy on both desktop and mobile.


250+

600+


Frequently asked questions
A network traffic monitoring system is a secure online platform where IT teams and network administrators can log in to track and analyze real-time network activity. It centralizes all network data, alerts, and reports in one place, so you don’t have to juggle multiple tools or sift through spreadsheets. This helps your team quickly identify issues, monitor usage patterns, and keep your network running smoothly.
Softr makes it easy to build a network traffic monitoring system that’s tailored to your organization’s needs. You can connect your existing network data—from sources like Airtable, SQL databases, or Notion—and set up a portal where team members can log in, view network metrics, receive alerts, and access detailed reports, all in one place.
There’s no coding required. You can start with a template or build from scratch, customize the layout, set user permissions, and brand the platform to match your organization. It’s quick to launch, easy to update, and flexible enough to scale with your network as it grows.
You can add a variety of features to your network traffic monitoring system, depending on how your team operates. Some common features include:
\- User logins – so each admin or analyst can access their own dashboard
\- Custom dashboards – to display network status, bandwidth usage, or real-time alerts
\- Forms – for reporting incidents or submitting network change requests
\- File sharing – for uploading and downloading network logs or documentation
\- Search and filters – to quickly review specific devices or incidents
\- Tables, lists, and detail views – to display logs, user activity, or device details
\- Comments or status updates – to track resolutions and team communication
\- Charts – to visualize network traffic patterns or incident trends
\- Calendar view – for scheduling maintenance or tracking outages
\- Permissions and roles – so each user only sees relevant information
All of these features can be built using Softr’s drag-and-drop blocks, so there’s no need to write any code. If your monitoring needs change, you can easily update the system at any time.
No coding is required. You can build your network traffic monitoring system entirely using Softr’s visual editor. Everything from dashboards to user permissions can be customized without writing a single line of code.
Yes. You can manage multiple networks or teams within a single network traffic monitoring system. Each user will only see the monitoring data and dashboards assigned to them, based on their login and role. This setup is especially useful for IT departments, MSPs, or organizations overseeing several networks or offices from one centralized platform.
Softr supports a variety of data sources for your network traffic monitoring system. You can connect to Airtable, Google Sheets, Notion, Coda, monday.com, HubSpot, Clickup, Xano, Supabase, PostgreSQL, MySQL, SQL Server, MariaDB, BigQuery, and more. With the REST API, you can also integrate data from your own network monitoring tools or other custom sources.
You aren’t limited to just one data source. You can combine multiple data sources within the same system and display them together—so your monitoring dashboard can, for example, show network logs from Airtable alongside device status from Google Sheets. Most sources allow real-time, two-way sync, so any updates happen automatically across your app and connected sources.
Yes, Softr gives you full control over how users interact with your network traffic monitoring system. You can customize the layout, navigation, and dashboard widgets to match your organization’s needs. Each page or block can be set to display only for certain users or roles, so network administrators, support staff, or clients each see only the information relevant to them.
You can define user roles such as network admin, technician, or viewer, and specify what each role can access or modify. For instance, clients might only view their own network data and reports, while admins have access to all monitored networks. Personalized dashboards and data views can also be configured based on the user’s role and login, ensuring security and clarity for everyone involved.
Yes, you can. You don’t need to have existing network data in another tool to start building your network traffic monitoring system with Softr. If you’re starting from scratch, you can use Softr Databases, which is included in the platform and works seamlessly with your monitoring dashboards and alerts.
If you already collect network data in tools like Airtable, Google Sheets, or similar platforms, you can connect those as well. Softr’s REST API connector also lets you bring in data directly from your network devices or monitoring solutions. Either way, you control how monitoring data is structured and displayed in your system.
Yes, you can fully white-label your network traffic monitoring system in Softr. You can use your own logo, brand colors, fonts, and custom domain to make the system feel like a seamless part of your organization’s IT infrastructure. All Softr branding can be removed, so your team and stakeholders only see your organization’s identity throughout the monitoring experience.
Absolutely. Softr gives you robust flexibility to control the look and structure of your network traffic monitoring system. You can adjust colors, fonts, spacing, and page layouts to match your IT branding guidelines. It’s easy to choose how each dashboard or report is laid out, decide which data blocks or charts to display, and set what different users—such as admins, analysts, or managers—see when they log in.
To showcase your network data, you can add a variety of blocks depending on your needs:
\- Table blocks – to display metrics like device lists, bandwidth usage, or traffic logs
\- List or Card blocks – to highlight network segments, alerts, or endpoints
\- Detail View – for drilling into a single device or incident
\- Forms – for incident reporting or feedback
\- Charts – to visualize trends or anomalies
\- Calendar blocks – to track scheduled maintenance or monitoring windows
If your monitoring requirements change, it’s simple to make updates directly in the visual builder.
Softr is built with security as a priority. All network traffic data is encrypted in transit (TLS) and at rest, and your monitoring system is hosted on secure, reliable infrastructure. You have fine-grained control over user access, with role-based permissions, user management in your data source, visibility rules, and app-wide restrictions to safeguard sensitive network information.
If your monitoring system connects to external data sources like Airtable, Notion, or SQL, Softr doesn’t store your network data—it simply displays it in real time according to your access settings. You’re always in control of who can view or edit your network traffic data.
Softr also adheres to best practices for authentication, access control, and platform monitoring to keep your network information safe.
You can start building your network traffic monitoring system for free. Softr’s Free plan allows you to publish one app with up to 10 users and 2 user groups, with access to all standard data sources like Softr Databases, Airtable, Google Sheets, and more.
If your monitoring system requires additional users or advanced features, you can explore the paid plans: <http://softr.io/pricing>
Softr is designed to help you quickly create fully functional, user-facing systems—like network traffic monitoring platforms—without needing to write code. Its main strengths are the speed from idea to implementation, and its seamless integration with your existing data sources.
Compared to other no-code tools that might focus on mobile apps or require more developer expertise, Softr caters to IT and operations teams looking for full control over dashboard layout, user permissions, and experience. You can build on top of real-time data from sources like Airtable, Google Sheets, Softr Databases, or SQL, and deliver secure, branded monitoring tools for your team.
Everything can be customized visually—from dashboards to user access. With built-in features like user roles, forms, conditional logic, and API support, there’s no need to patch together multiple tools to launch a professional monitoring system.
Yes. Softr supports a wide range of integrations so you can connect your network traffic monitoring system with the rest of your IT stack. You can automate processes and alerts using Zapier, Make, or N8N, and synchronize with other IT tools as needed. Softr also offers REST API and webhooks for more advanced automations.
Whether you want to push network events to another platform, trigger automations based on real-time thresholds, or display third-party monitoring data, you can build these workflows into your monitoring system—no coding required.


