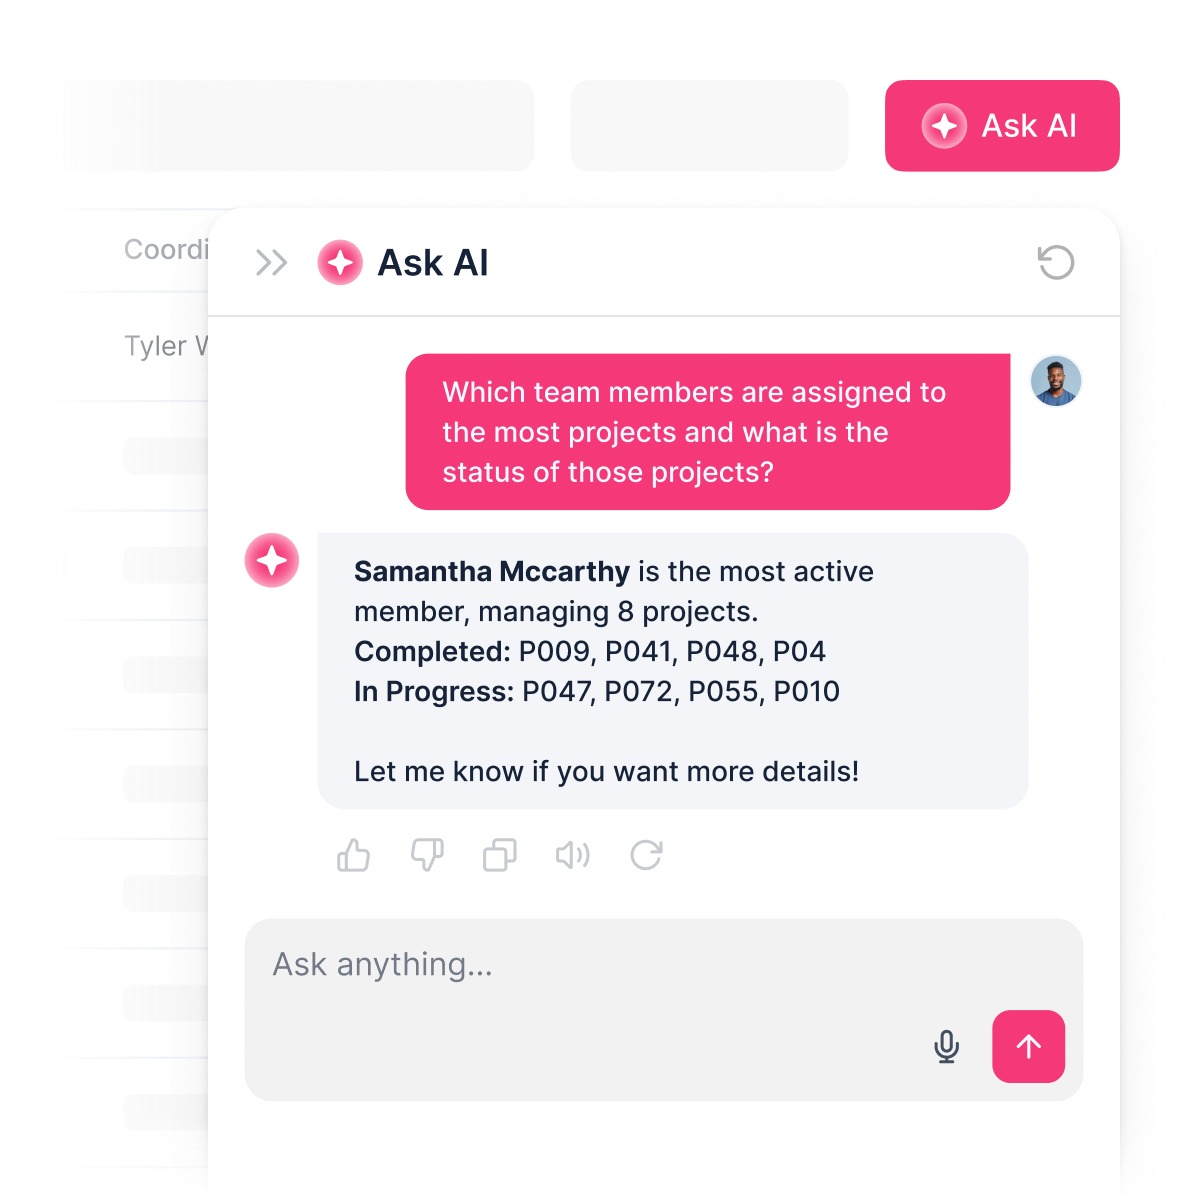
Create operations dashboards, with AI and no code.
Stop wasting time on manual reporting. Create dashboards that help you track real-time metrics and use AI to surface insights.


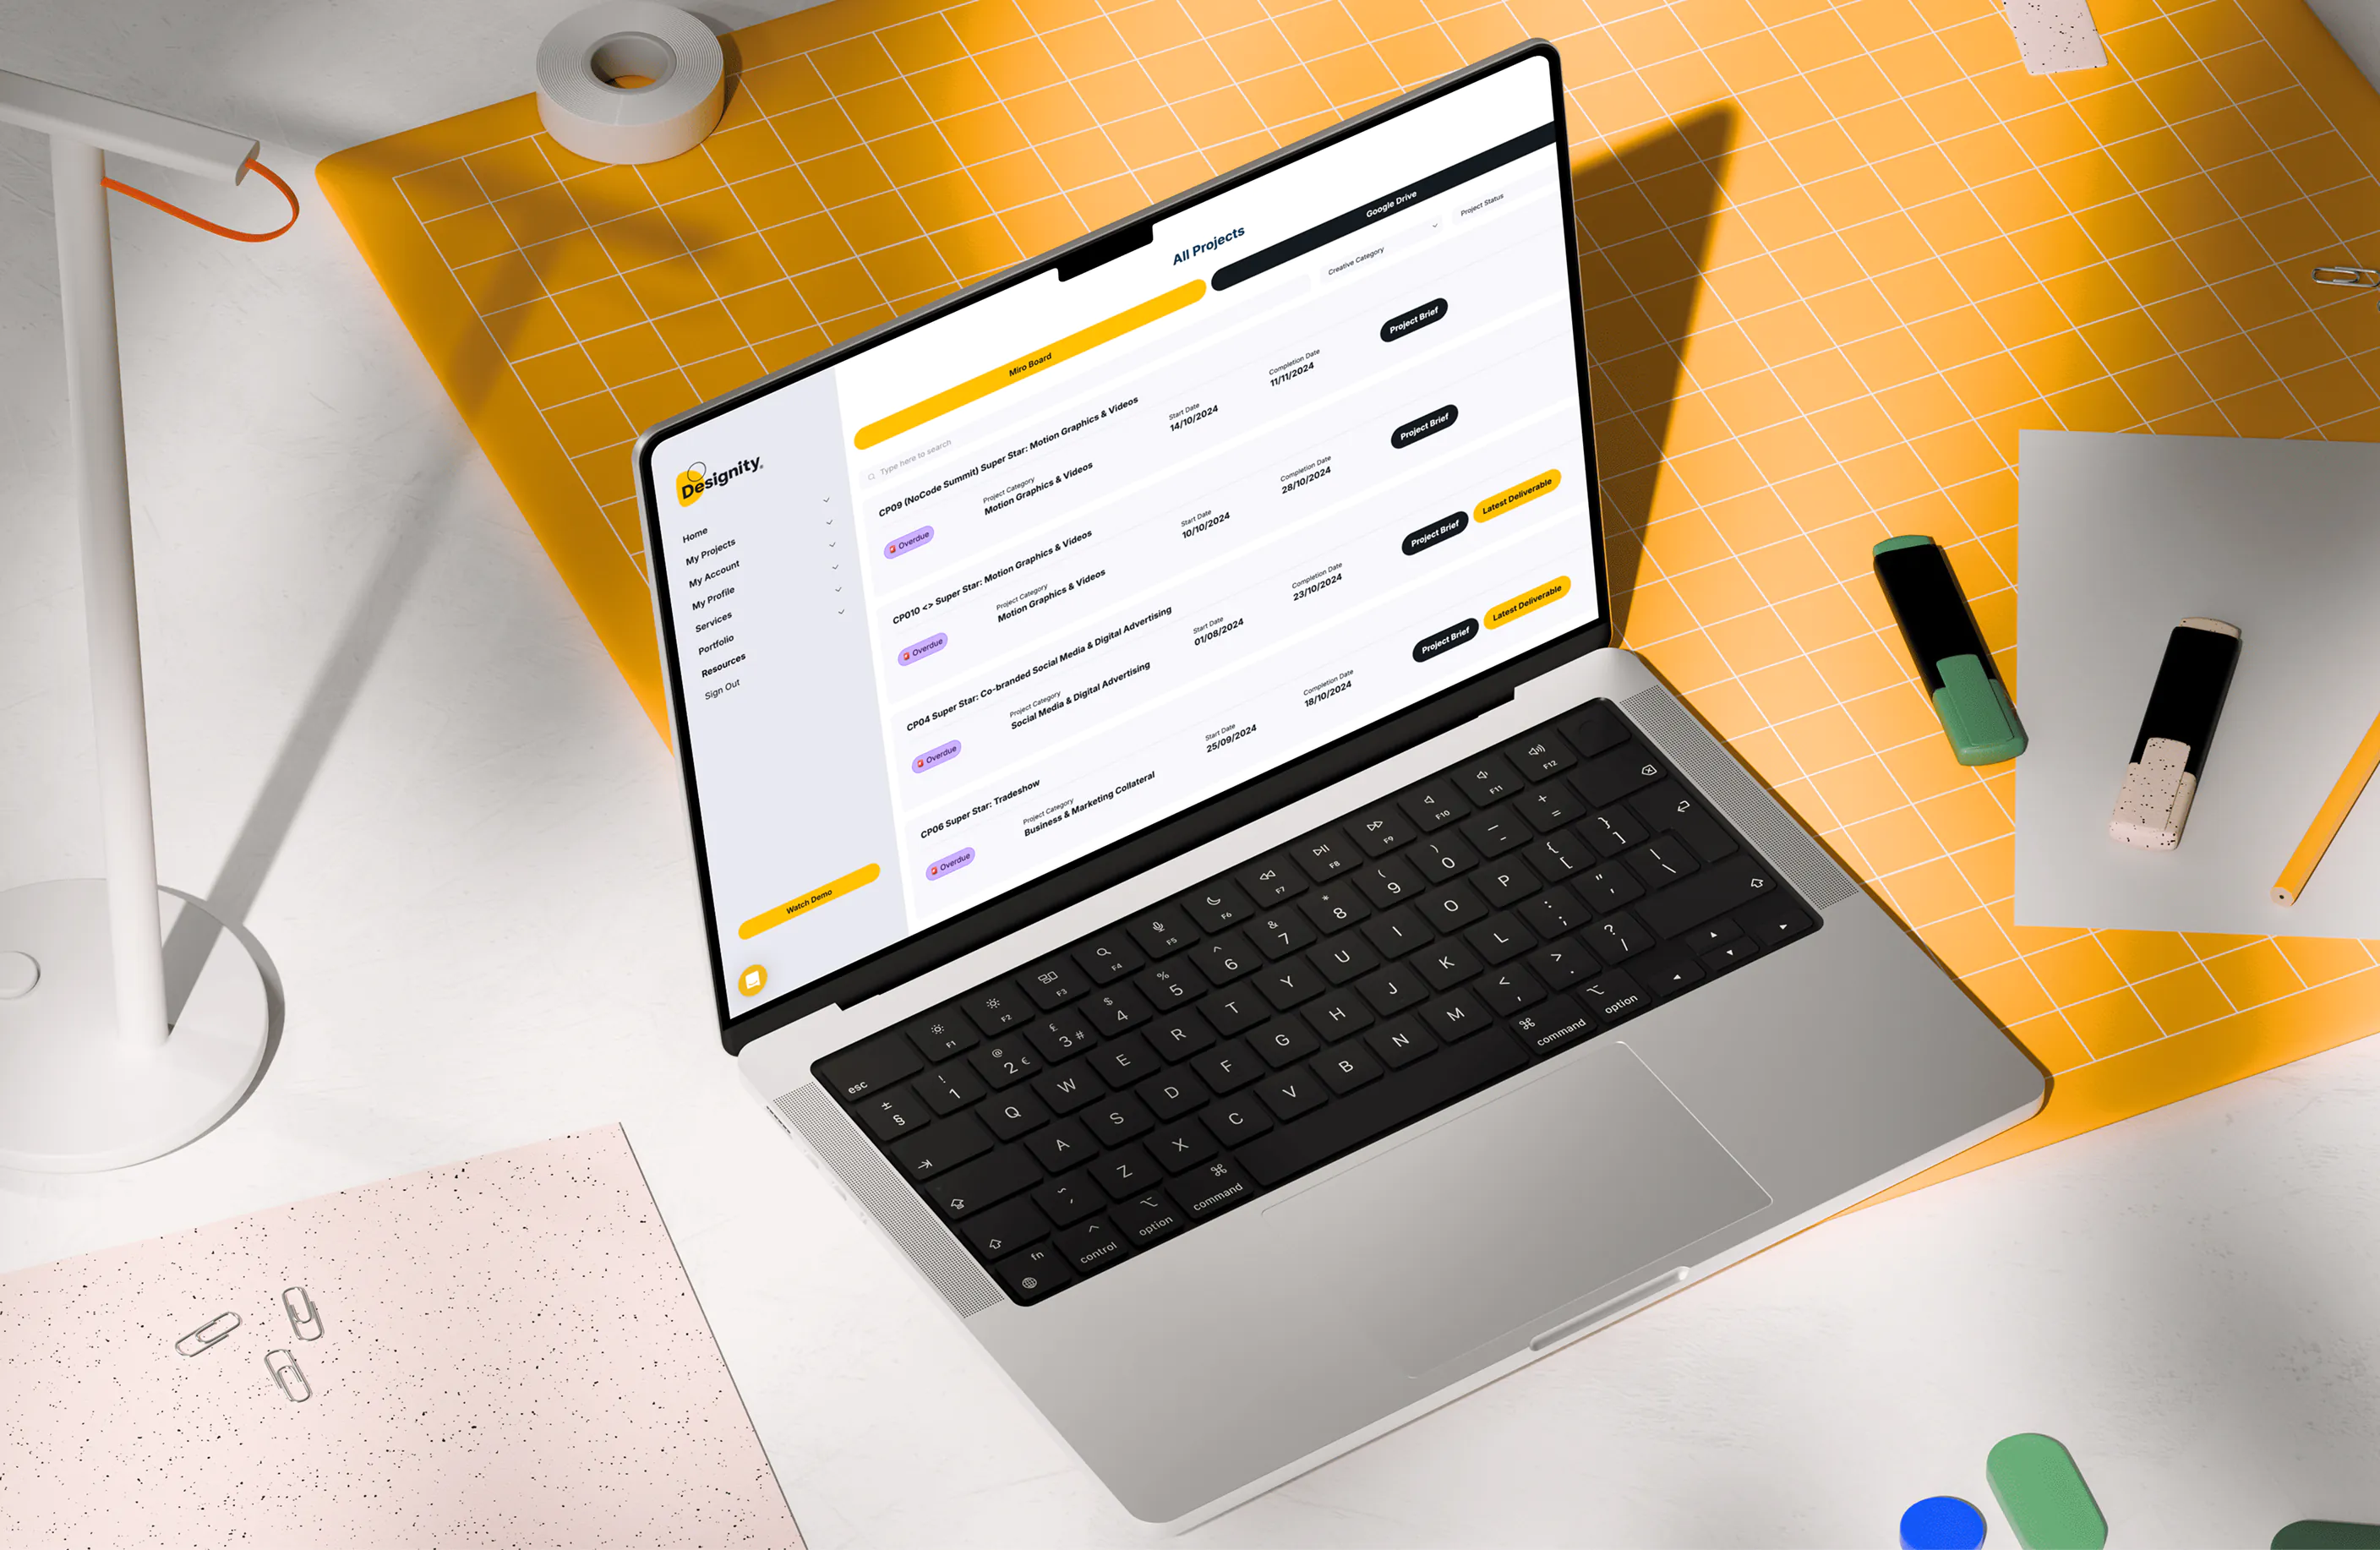
All your business data, in one dashboard.
Connect Softr to 15+ data sources or your REST API to bring everything into one place. No manual exports or siloed tools.
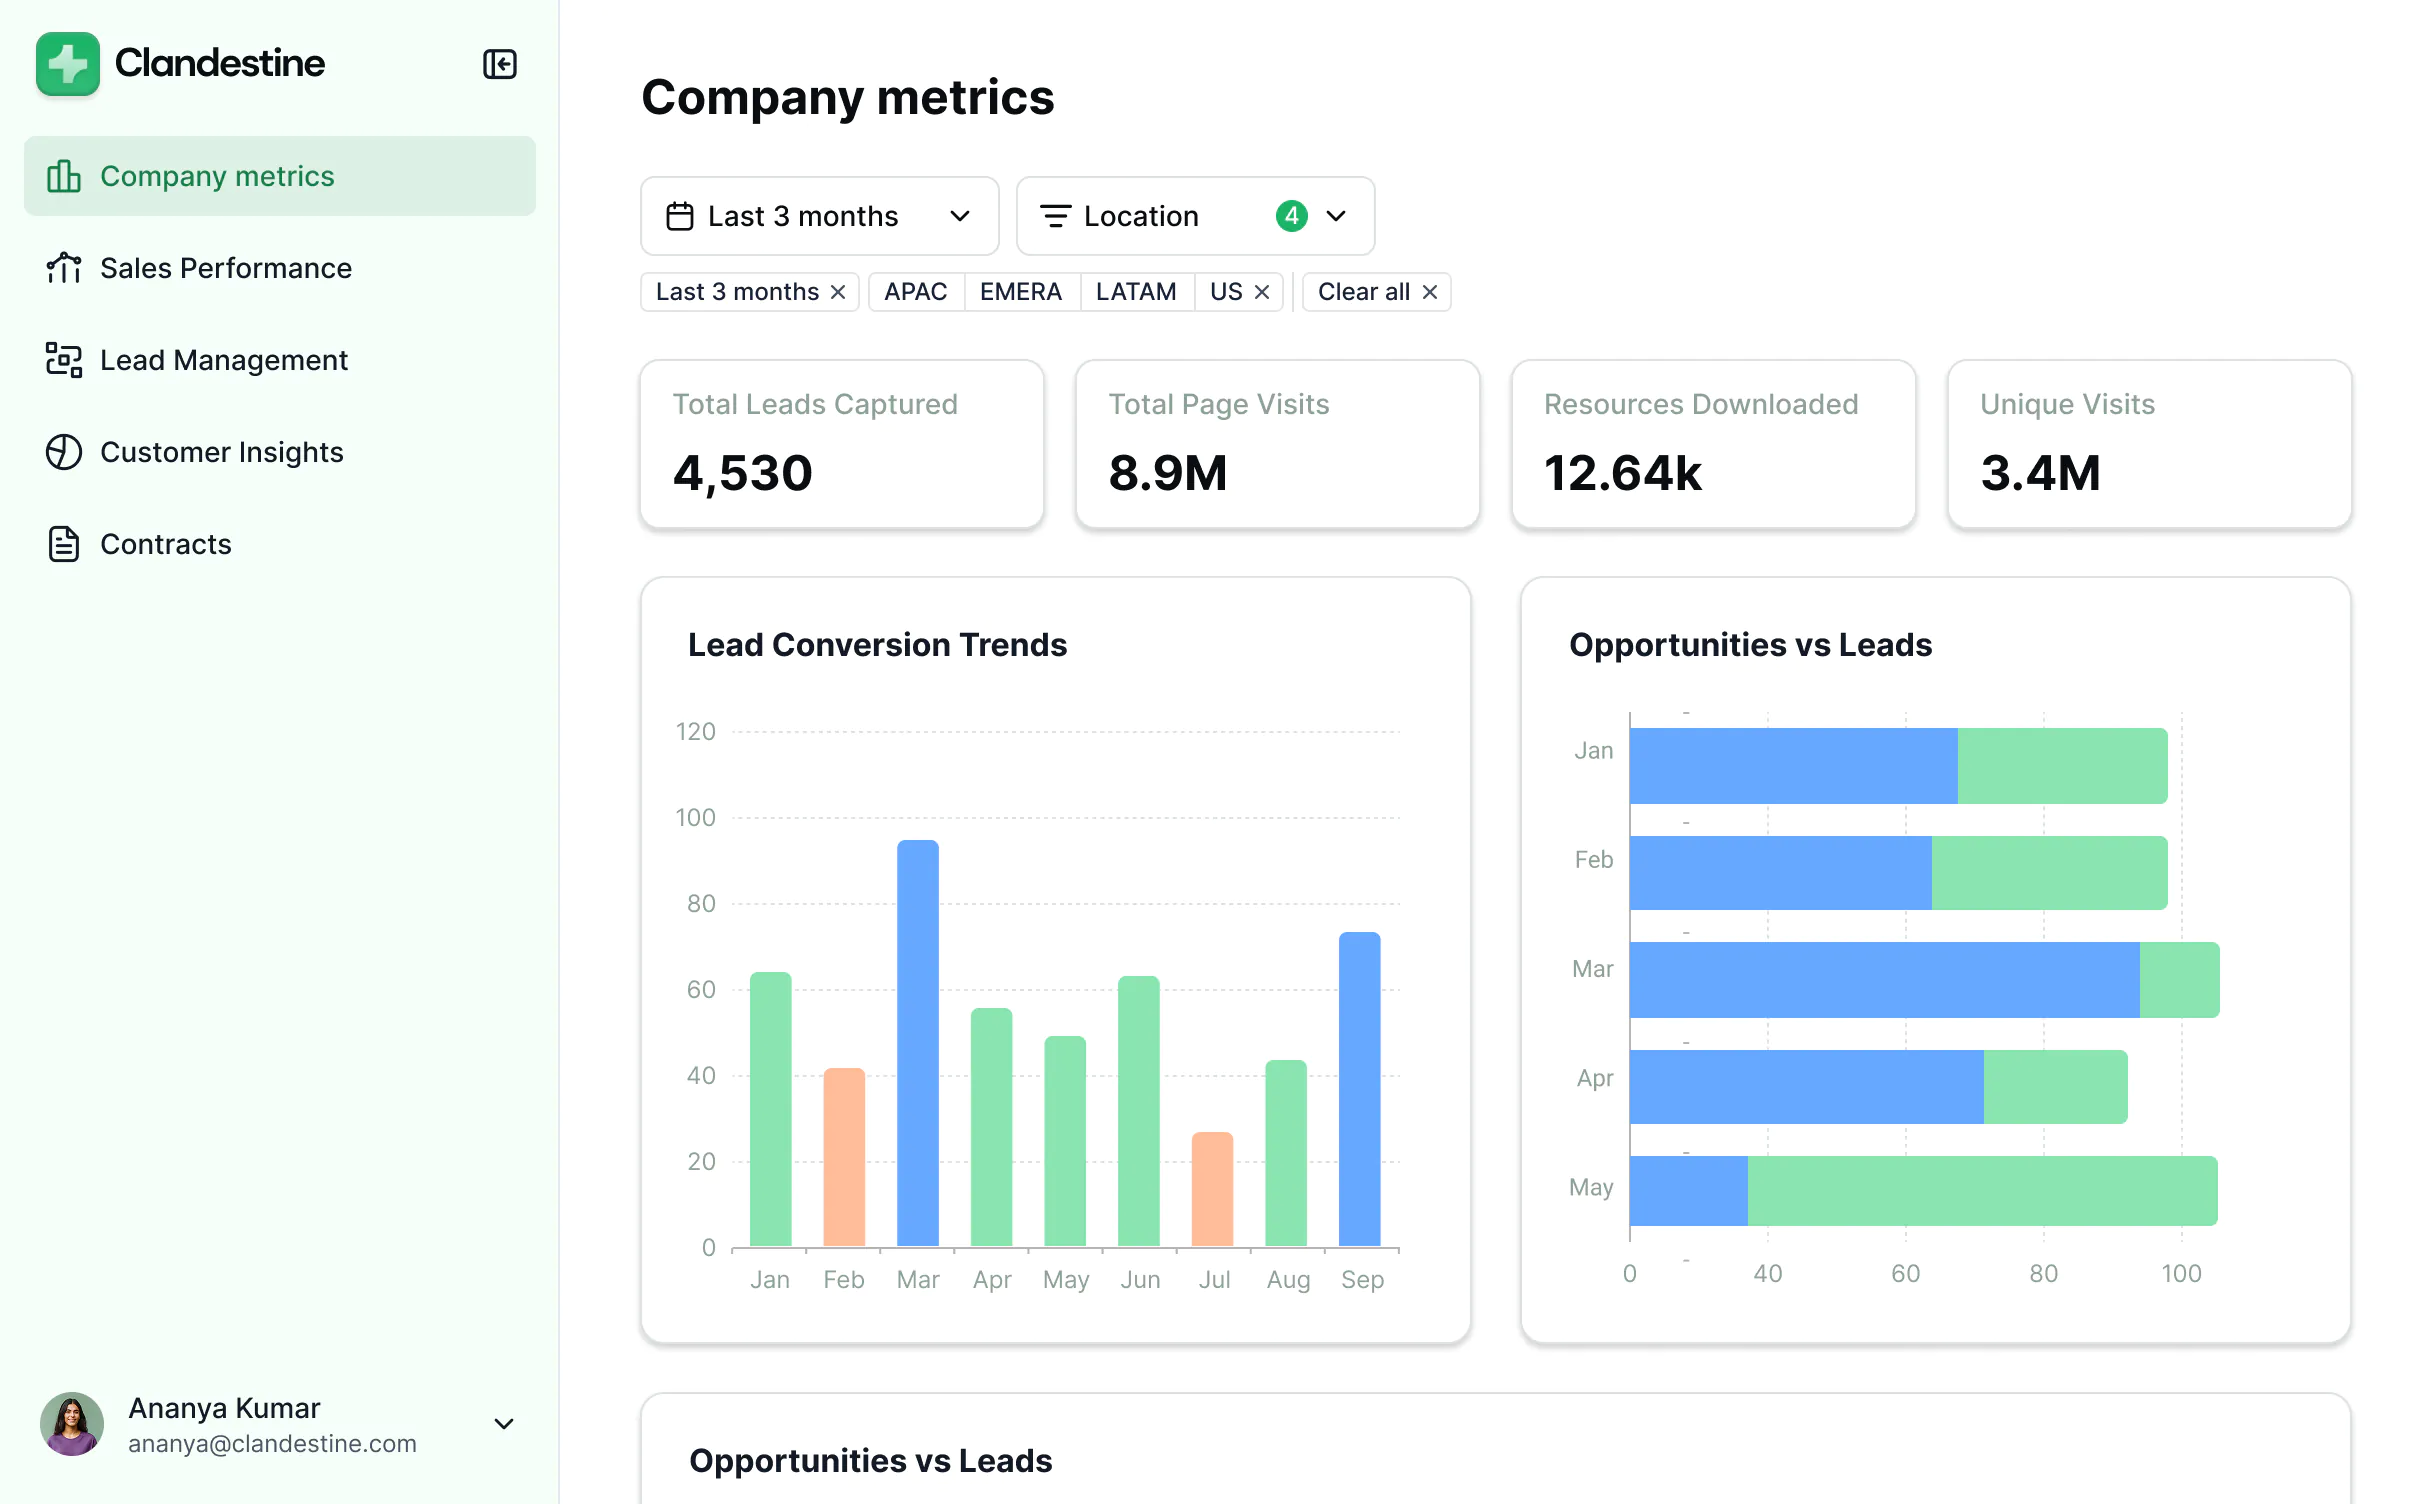
Dashboards tailored to every team or client.
Create role-specific dashboards for sales, finance, operations, or clients. Drag-and-drop blocks let you design exactly what each team needs.


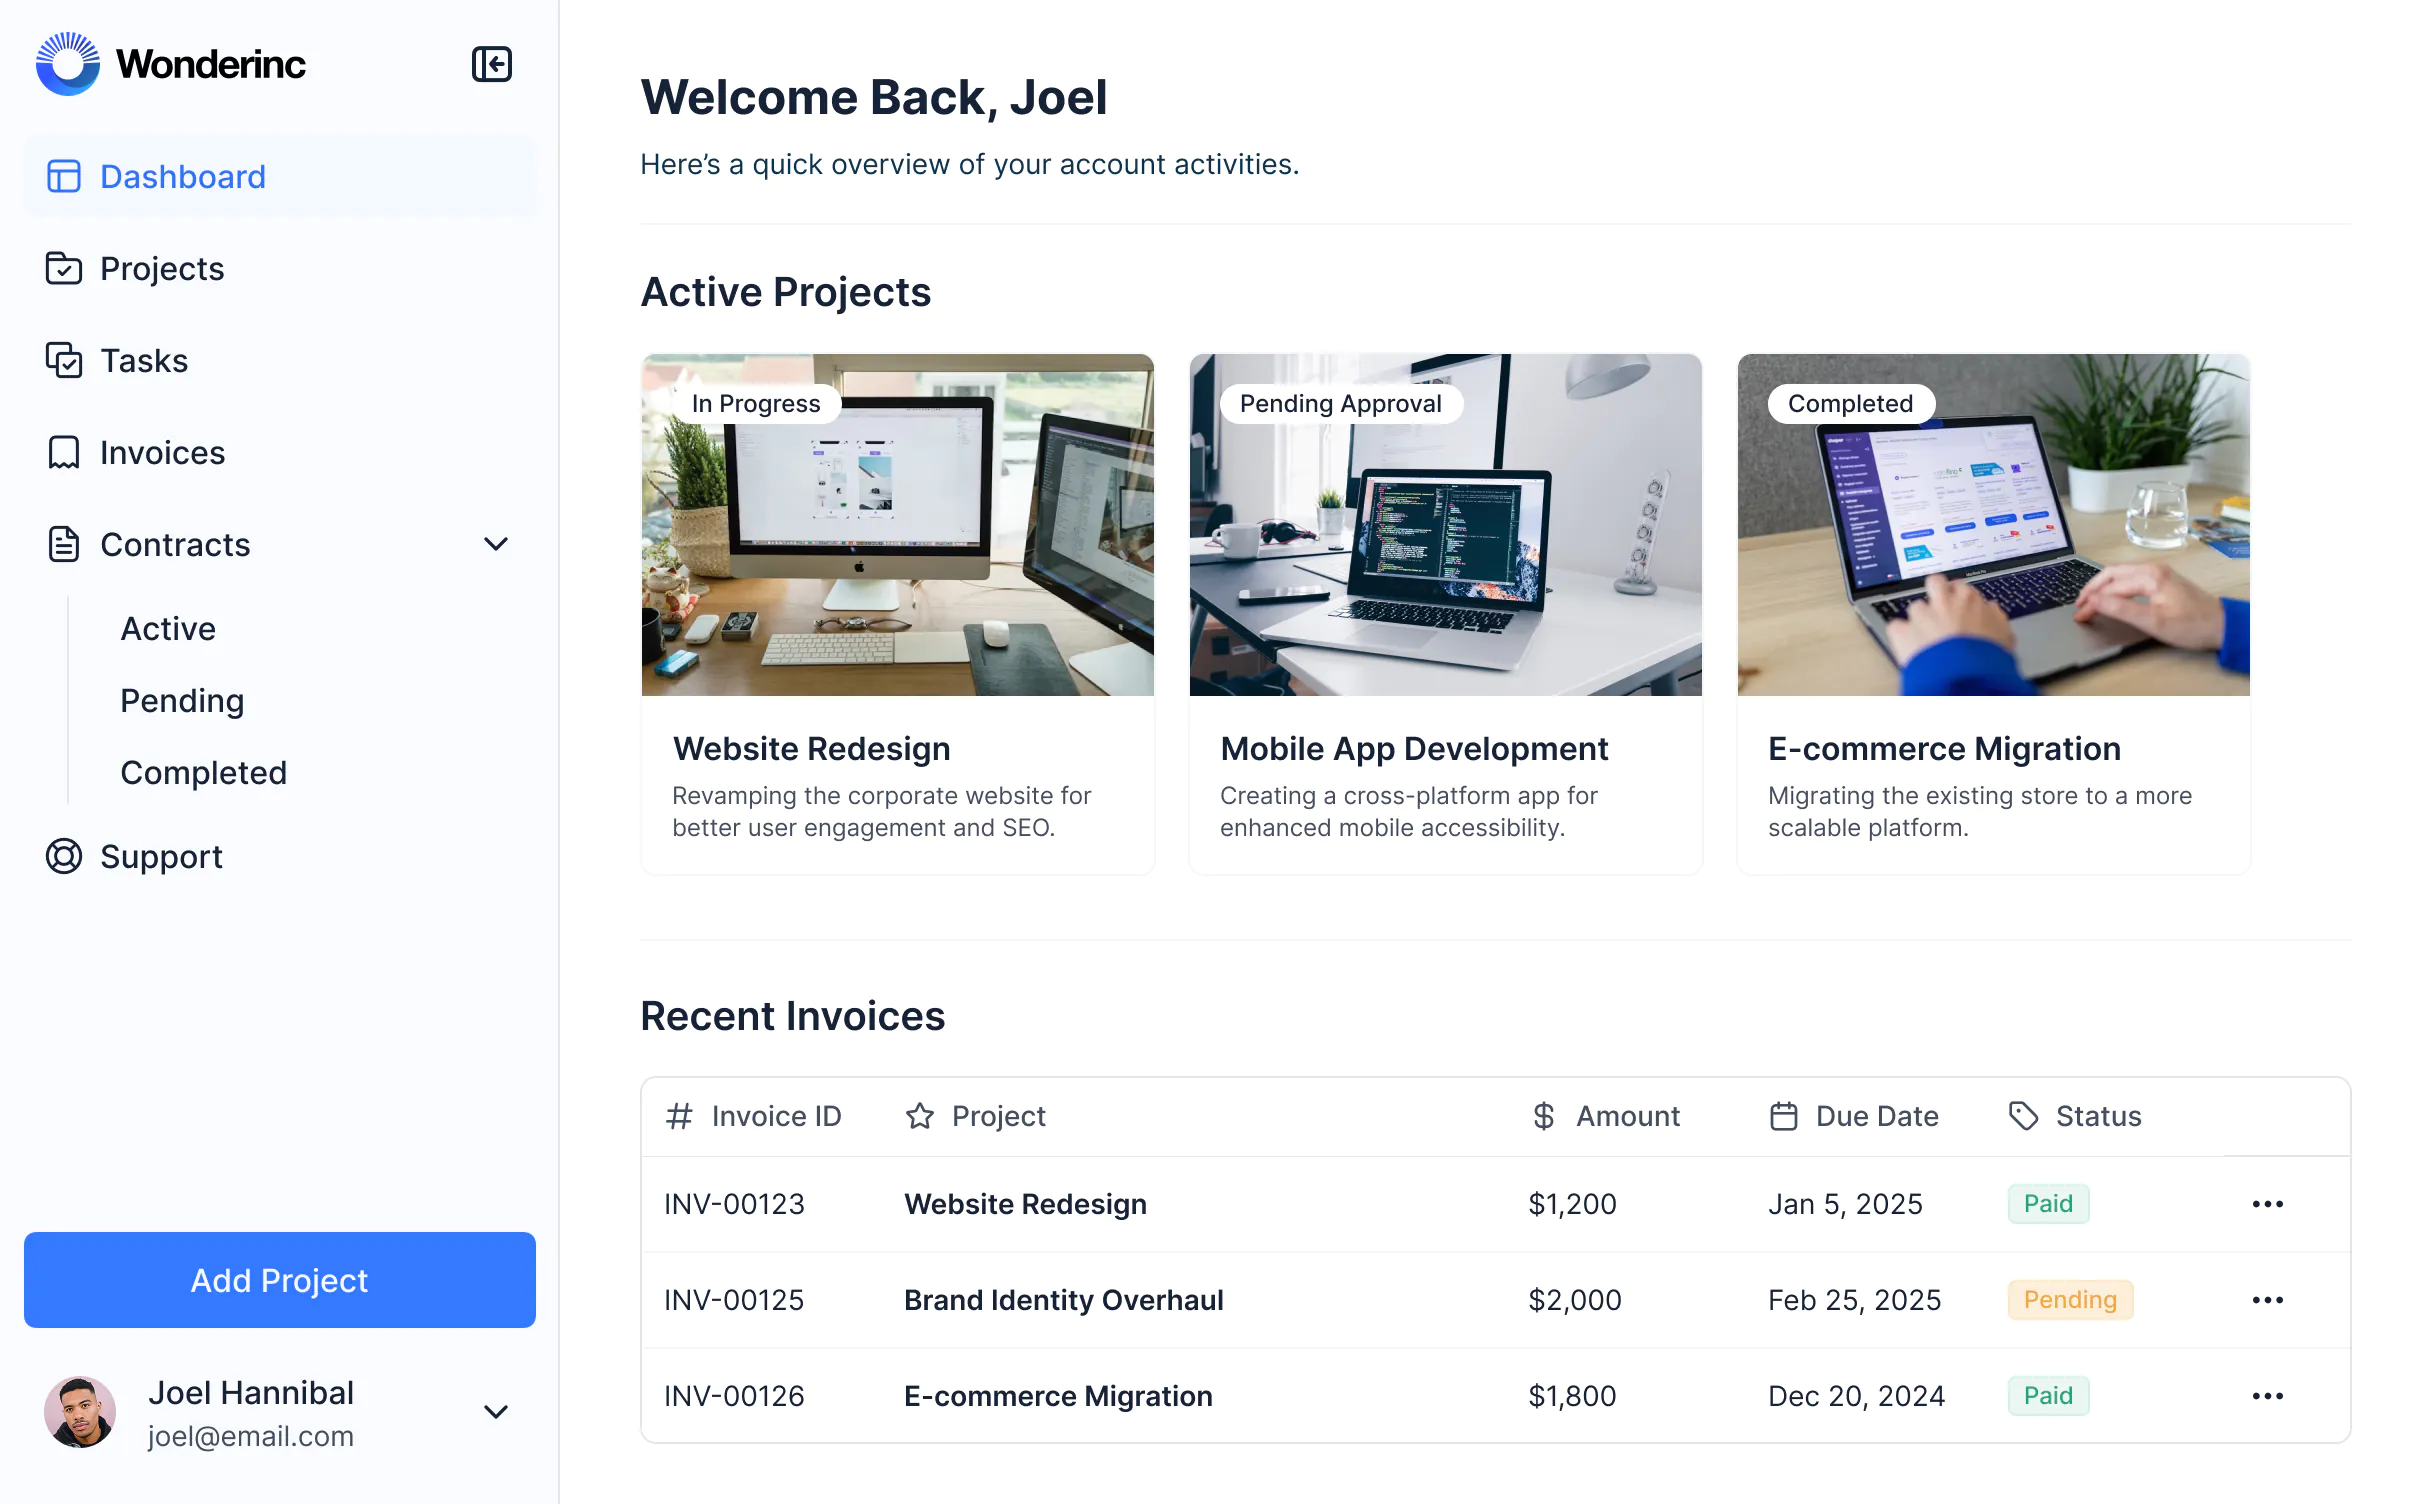
Enterprise-ready dashboards that scale with you.
Secure, branded, and accessible on any device—so your team and clients always have the right insights.
Branding & layouts
Deliver client-ready dashboards and reporting tools that look and feel like your company brand.
Works on any device
Share dashboards that can be accessed as a mobile app in one click with Softr’s PWA feature — no extra design work needed.
Automations
Connect with tools like Zapier, Make, or n8n to integrate other apps and update dashboards automatically.
User groups
Create custom user groups and separate logins to provide different views and access levels for your team.
Advanced permissions
Share dashboards securely with teams or clients. Customize who sees what, even at the most granular level.
Security
Protect information from security threats. Softr is fully compliant with SOC2 and GDPR regulations.
Replace spreadsheets with any tool you need.
Stop overspending on pricey software with unused features. Build custom apps that fit your workflows perfectly.
Go from zero to app, incredibly fast
Connect to your data in seconds
Integrate with your spreadsheets and databases, including Airtable, SQL, Hubspot, Google Sheets, Supabase, BigQuery, and more—in just a few clicks. Your data is always secure and in sync.
Customize layout and logic
Drag and drop customizable building blocks with various views and functionalities. Granular permissions allow you to control what data each user can access, and which actions they can take.
Publish and launch
Ship applications that your team will love in minutes or hours, instead of days or weeks. Deploy on both desktop and mobile.


Frequently asked questions
A dashboard is a visual interface that brings together data from different sources and displays it in charts, tables, and metrics so you can track performance at a glance. It centralizes key business information—such as sales revenue, customer activity, expenses, or team productivity—into one view, making it easier for teams to monitor progress and make data-driven decisions.
With a dashboard, managers and teams can see real-time updates, compare performance over time, and quickly identify where action is needed.
A dashboard is used to monitor metrics, track progress toward goals, and provide visibility across teams or clients.
Businesses use dashboards to:
- Track KPIs such as sales, revenue, or churn.
- Visualize financial data like budgets and expenses.
- Monitor project progress, deadlines, and team productivity.
- Report campaign results and ROI to stakeholders or clients.
- Consolidate multiple tools and spreadsheets into one live view.
In short, dashboards help teams replace static reports with real-time, interactive insights that are always up to date.
Most tools provide standard dashboards with fixed layouts and limited flexibility. A custom dashboard goes further: you decide exactly what data to track, how it’s displayed, and who can access it. This makes dashboards far more useful because they reflect your business, not a generic template.
Key benefits of a custom dashboard include:
- Tailored metrics: Track only the KPIs that matter for your team or clients, instead of being stuck with default reports.
- Flexible design: Choose the layout, filters, and visualizations that make sense for your workflows.
- Integration options: Pull data from spreadsheets, CRMs, databases, or APIs into one live view.
- Role-based views: Give managers, teammates, or clients different dashboards, each showing just what’s relevant to them.
- Scalability: Start with a simple set of charts and expand into multi-page dashboards, portals, or full reporting apps as you grow.
With Softr, you can create custom dashboards in hours—using drag-and-drop blocks, pre-built templates, and AI assistance—without needing developers or complex BI setups.
A good dashboard should help you understand performance at a glance and drill down into details when needed. Core features include:
- Data integrations: Connect spreadsheets, CRMs, databases, or APIs.
- Real-time updates: Keep reports live instead of exporting static files.
- Visualization options: Display KPIs in charts, tables, and cards.
- Filtering & drill-down: Let users explore by team, time period, or region.
- Collaboration & sharing: Give clients, managers, or teammates secure access.
- Customization: Adjust layouts, branding, and permissions to fit your use case.
With a custom Softr dashboard, you can go beyond the basics—adding branded client portals, AI-powered summaries, or automated workflows to act on data instantly.
Traditionally, building dashboards required expensive BI tools or developers to set up databases, queries, and custom code. That process was complex and slow. Today, you can build dashboards much faster with no-code platforms like Softr.
Here’s how it works in Softr:
- Connect your data: Pull from Airtable, Google Sheets, SQL, HubSpot, Notion, and more, or directly from Softr Databases. Or, you can use RestAPI to bring in data from nearly any service.
- Choose your layout: Use drag-and-drop blocks for charts, tables, leaderboards, or KPIs.
- Set permissions: Control which users or clients can access each dashboard.
- Apply branding: Add your logo, colors, and styling so reports look professional.
- Add workflows & automation: Trigger alerts, notifications, or updates when data changes.
- Publish & share: Get your dashboard live in hours, then refine it as your needs evolve.
With Softr, dashboards are easy to launch, update, and scale—without needing developers.
Yes. With Softr, you can build lightweight dashboards that replace spreadsheets or static slide decks—no coding required. You can:
- Start with pre-built templates for sales, finance, or client reporting.
- Customize layouts and filters for your team’s workflow.
- Connect to tools you already use like Airtable, Google Sheets, SQL, Notion, HubSpot, and more.
- Share dashboards securely with your team or external clients.
This way, you avoid complex BI tools and create a simple, effective dashboard your team will actually use.
Softr supports multiple data sources, so your dashboard can fit any area of your business.
Supported sources include:
- Spreadsheets: Airtable, Google Sheets.
- Databases: PostgreSQL, MySQL, SQL Server, Supabase, MariaDB.
- Business tools: HubSpot, Notion, ClickUp, Monday.com.
- APIs: REST API or custom integrations.
- Softr Databases: Manage and visualize your data directly in Softr.
In practice, dashboards often consolidate:
- Sales or revenue data (from CRMs or spreadsheets).
- Finance metrics (budgets, expenses, forecasts).
- Project tracking (from Notion, ClickUp, or Monday).
- Marketing performance (from forms, CRMs, or campaign trackers).
This flexibility lets Softr act as your single source of truth, without migrating everything into one rigid system.
Yes. Softr dashboards can do more than just display numbers—they can also surface insights with AI built in.
With Ask AI, your dashboard can instantly answer questions like:
- “What were sales by region this quarter?”
- “Which clients have overdue invoices?”
- “Summarize this month’s support performance.”
Unlike other tools that require setup or API keys, Softr’s AI assistant is built directly into your app. You can control what data it can access, apply permissions, and tailor it to your team’s needs—turning your dashboard into a smart reporting assistant.
Most dashboard and BI tools are complex, require IT support, or lock you into rigid templates. Softr is different because it offers no-code flexibility so you can build exactly what you need for your use case.
- Connect 15+ data sources or your REST API.
- Drag-and-drop layouts for charts, tables, and KPIs.
- Granular permissions so each user or client sees only their data.
- AI built in to summarize trends and answer questions.
- White-label branding for client-ready dashboards.
- Scales beyond dashboards into full portals, CRMs, or internal tools.
With Softr, you don’t just get another reporting tool—you get a flexible dashboard builder that adapts to your workflows and grows with your business.


