Track metrics, visualize health, and manage logs in an AI-powered system built with AI you customize to fit your IT team's workflow.

Customize your system performance monitoring dashboard with the exact views your team needs. Add features as processes evolve—no code needed.


Connect server logs, performance databases, and IT systems with real-time sync—or manage everything in Softr Databases. Create a single source of truth for your systems.
Give each teammate the right tools and access. Set up secure logins, user groups, and granular permissions—no IT support or dev work needed.
Give different team members tailored access and dashboards, so each role sees just the performance data that matters to them.
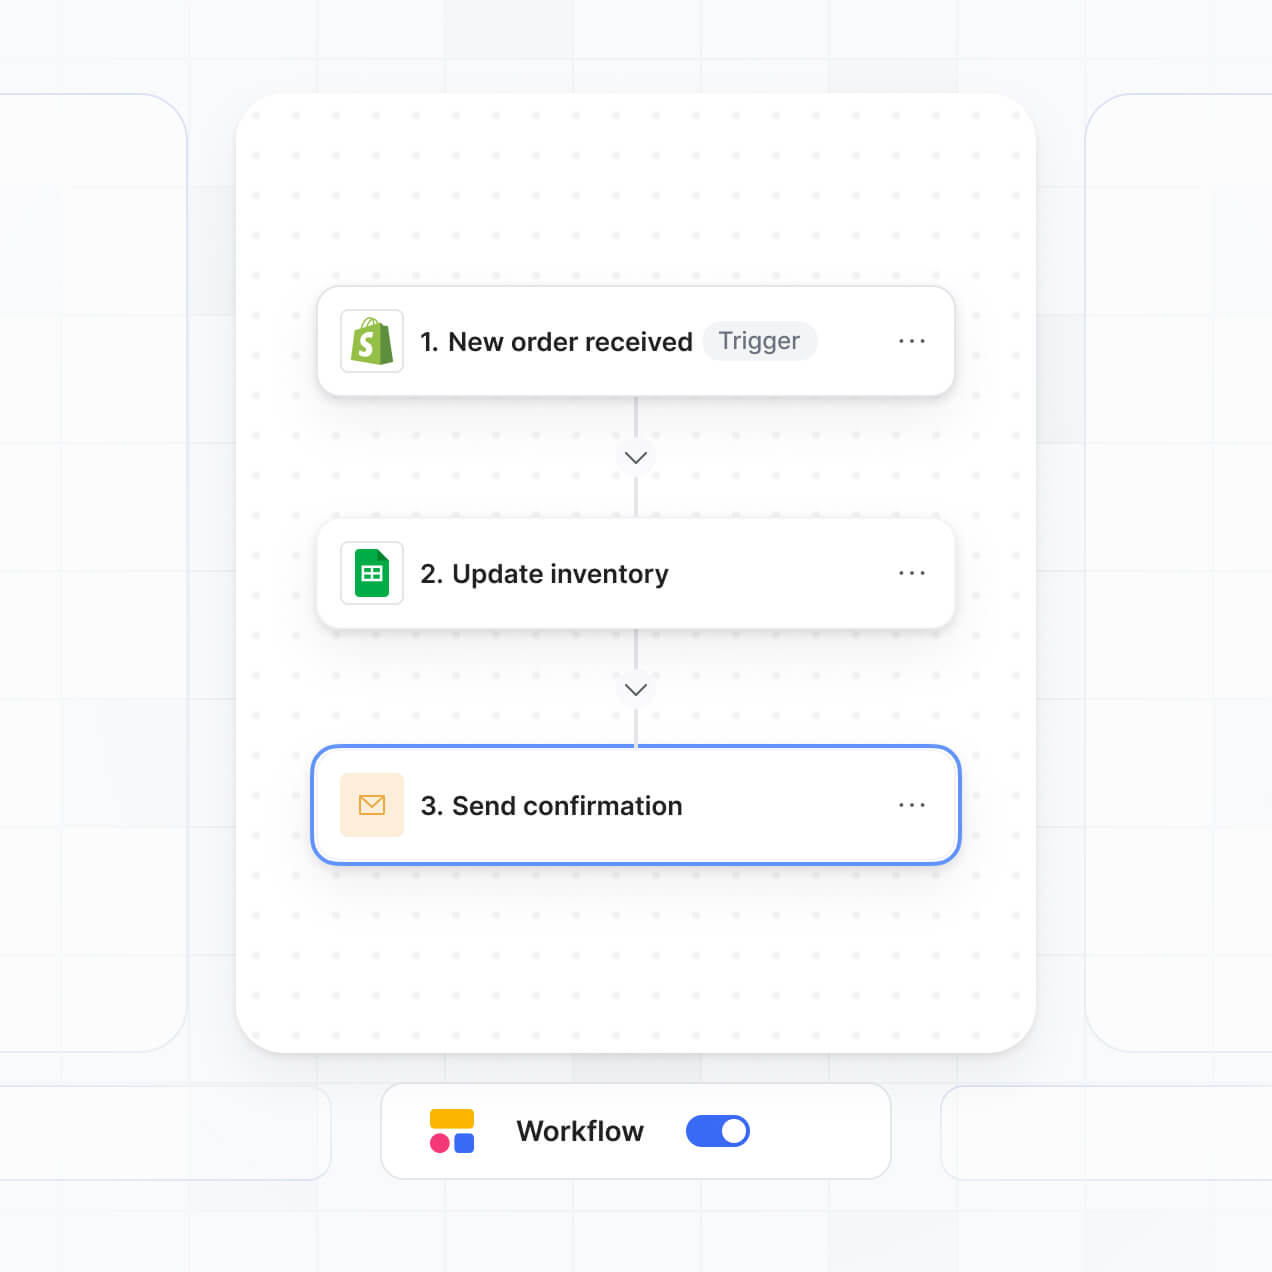
Streamline your response with Softr Workflows. Trigger native alerts based on system changes or log events to keep your infrastructure running smoothly.
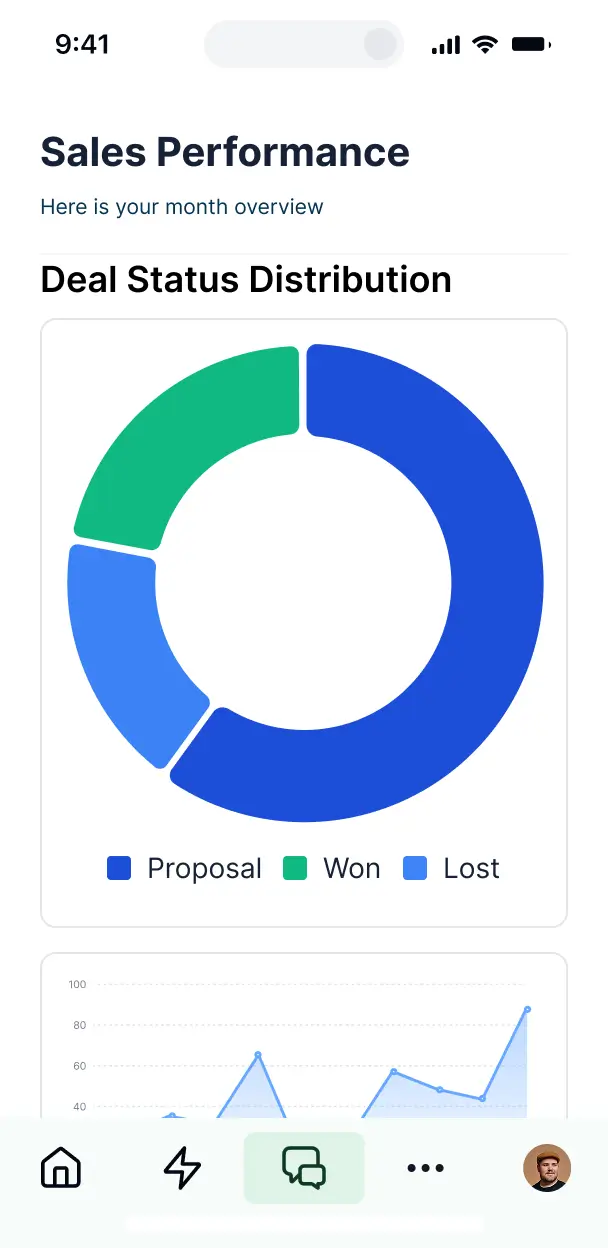
Access and update your monitoring tools on the go. All system dashboards are mobile-ready out of the box for round-the-clock visibility.
Use Google, email, or SSO logins to give your engineering team fast, secure access—no IT support tickets needed.
Keep infrastructure data safe with SOC2 and GDPR compliance, plus fine-tuned access control at every level of your monitoring dashboard.
No more one-size-fits-all tools or costly custom builds. Softr is easy to use and fully customizable, so you can launch faster, adapt as you grow, and skip the complexity of traditional software.

Build your system performance monitoring dashboard in minutes with AI—no manual setup needed.

Add features like incident tracking, reporting, or health alerts as your workflows evolve—no rebuild needed.

Start with a dashboard, then add incident portals or resource forms—all in one place, with no extra tools.
Co-build with AI
Simply describe what you need. Let Softr handle everything - Interface, database, workflows.
Iterate with AI or visually
Control most critical parts of your app yourself - roles, permissions, security.
Ship the same day
Invite team members or external clients and partners right away. No developer handover.
Use drag-and-drop blocks to build a portal that looks sleek and modern out of the box. Add only the features you need, and iterate as your workflows evolve.




A system performance monitoring dashboard is a secure, centralized hub where IT managers and DevOps engineers can track real-time server health, application uptime, and resource metrics. It consolidates technical data into visual reports and maps, replacing fragmented technical logs or static spreadsheets. This ensures your team can identify bottlenecks instantly and maintain optimal system reliability for your entire organization.
Softr is the first AI-native platform for building business software, making it the ideal choice for creating a custom system performance monitoring dashboard that aligns with your specific infrastructure. You can describe your monitoring requirements to the AI Co-Builder to instantly generate high-performance databases, status pages, and reporting logic—all fully connected and production-ready.
You don't need any coding skills to get started. Whether you generate the app via AI, choose a pre-built monitoring template, or build from scratch, everything runs on Softr Databases or your choice of external data sources like Google Sheets or SQL. You have granular control to customize the visual analytics, manage who has access to infrastructure data, and apply your own technical branding. It is designed to be deployed quickly, updated as your stack grows, and scaled with ease.
You can integrate a variety of specialized features into your system performance monitoring dashboard to ensure total visibility over your tech stack. A robust monitoring app typically combines standard data blocks with AI-driven insights:
- AI-Powered Intelligence – Use Ask AI to query your uptime history or set up Database AI Agents to perform automated anomaly detection or suggest server optimization strategies.
- Vibe Coding Blocks – Create custom technical components—like a real-time CPU utilization gauge or a network latency map—using the AI Code block to "vibe code" exactly what your engineers need.
- Softr Workflows – Set up native automations, such as an incident alert system, that triggers Slack notifications or email escalations whenever a system metric crosses a critical threshold.
- User Portals & Logins – Securely manage access so junior developers see basic metrics while lead architects have full administrative control over environment settings.
- Forms & Data Collection – Log incident reports or maintenance windows through custom forms with file attachments and conditional logic.
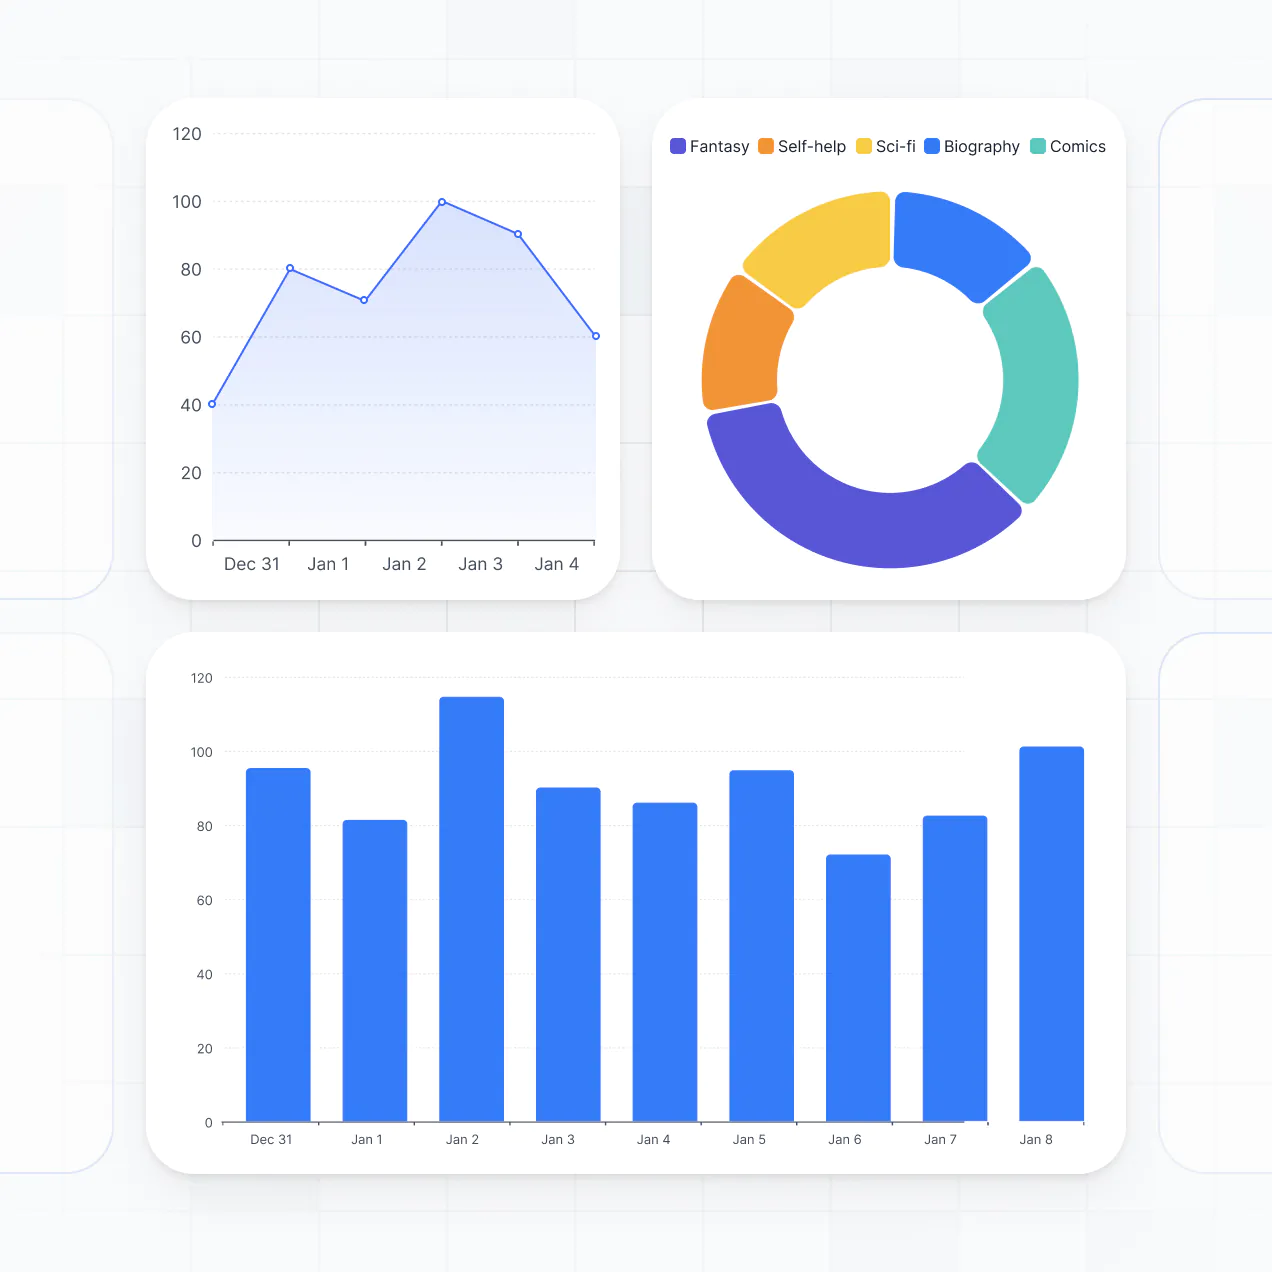
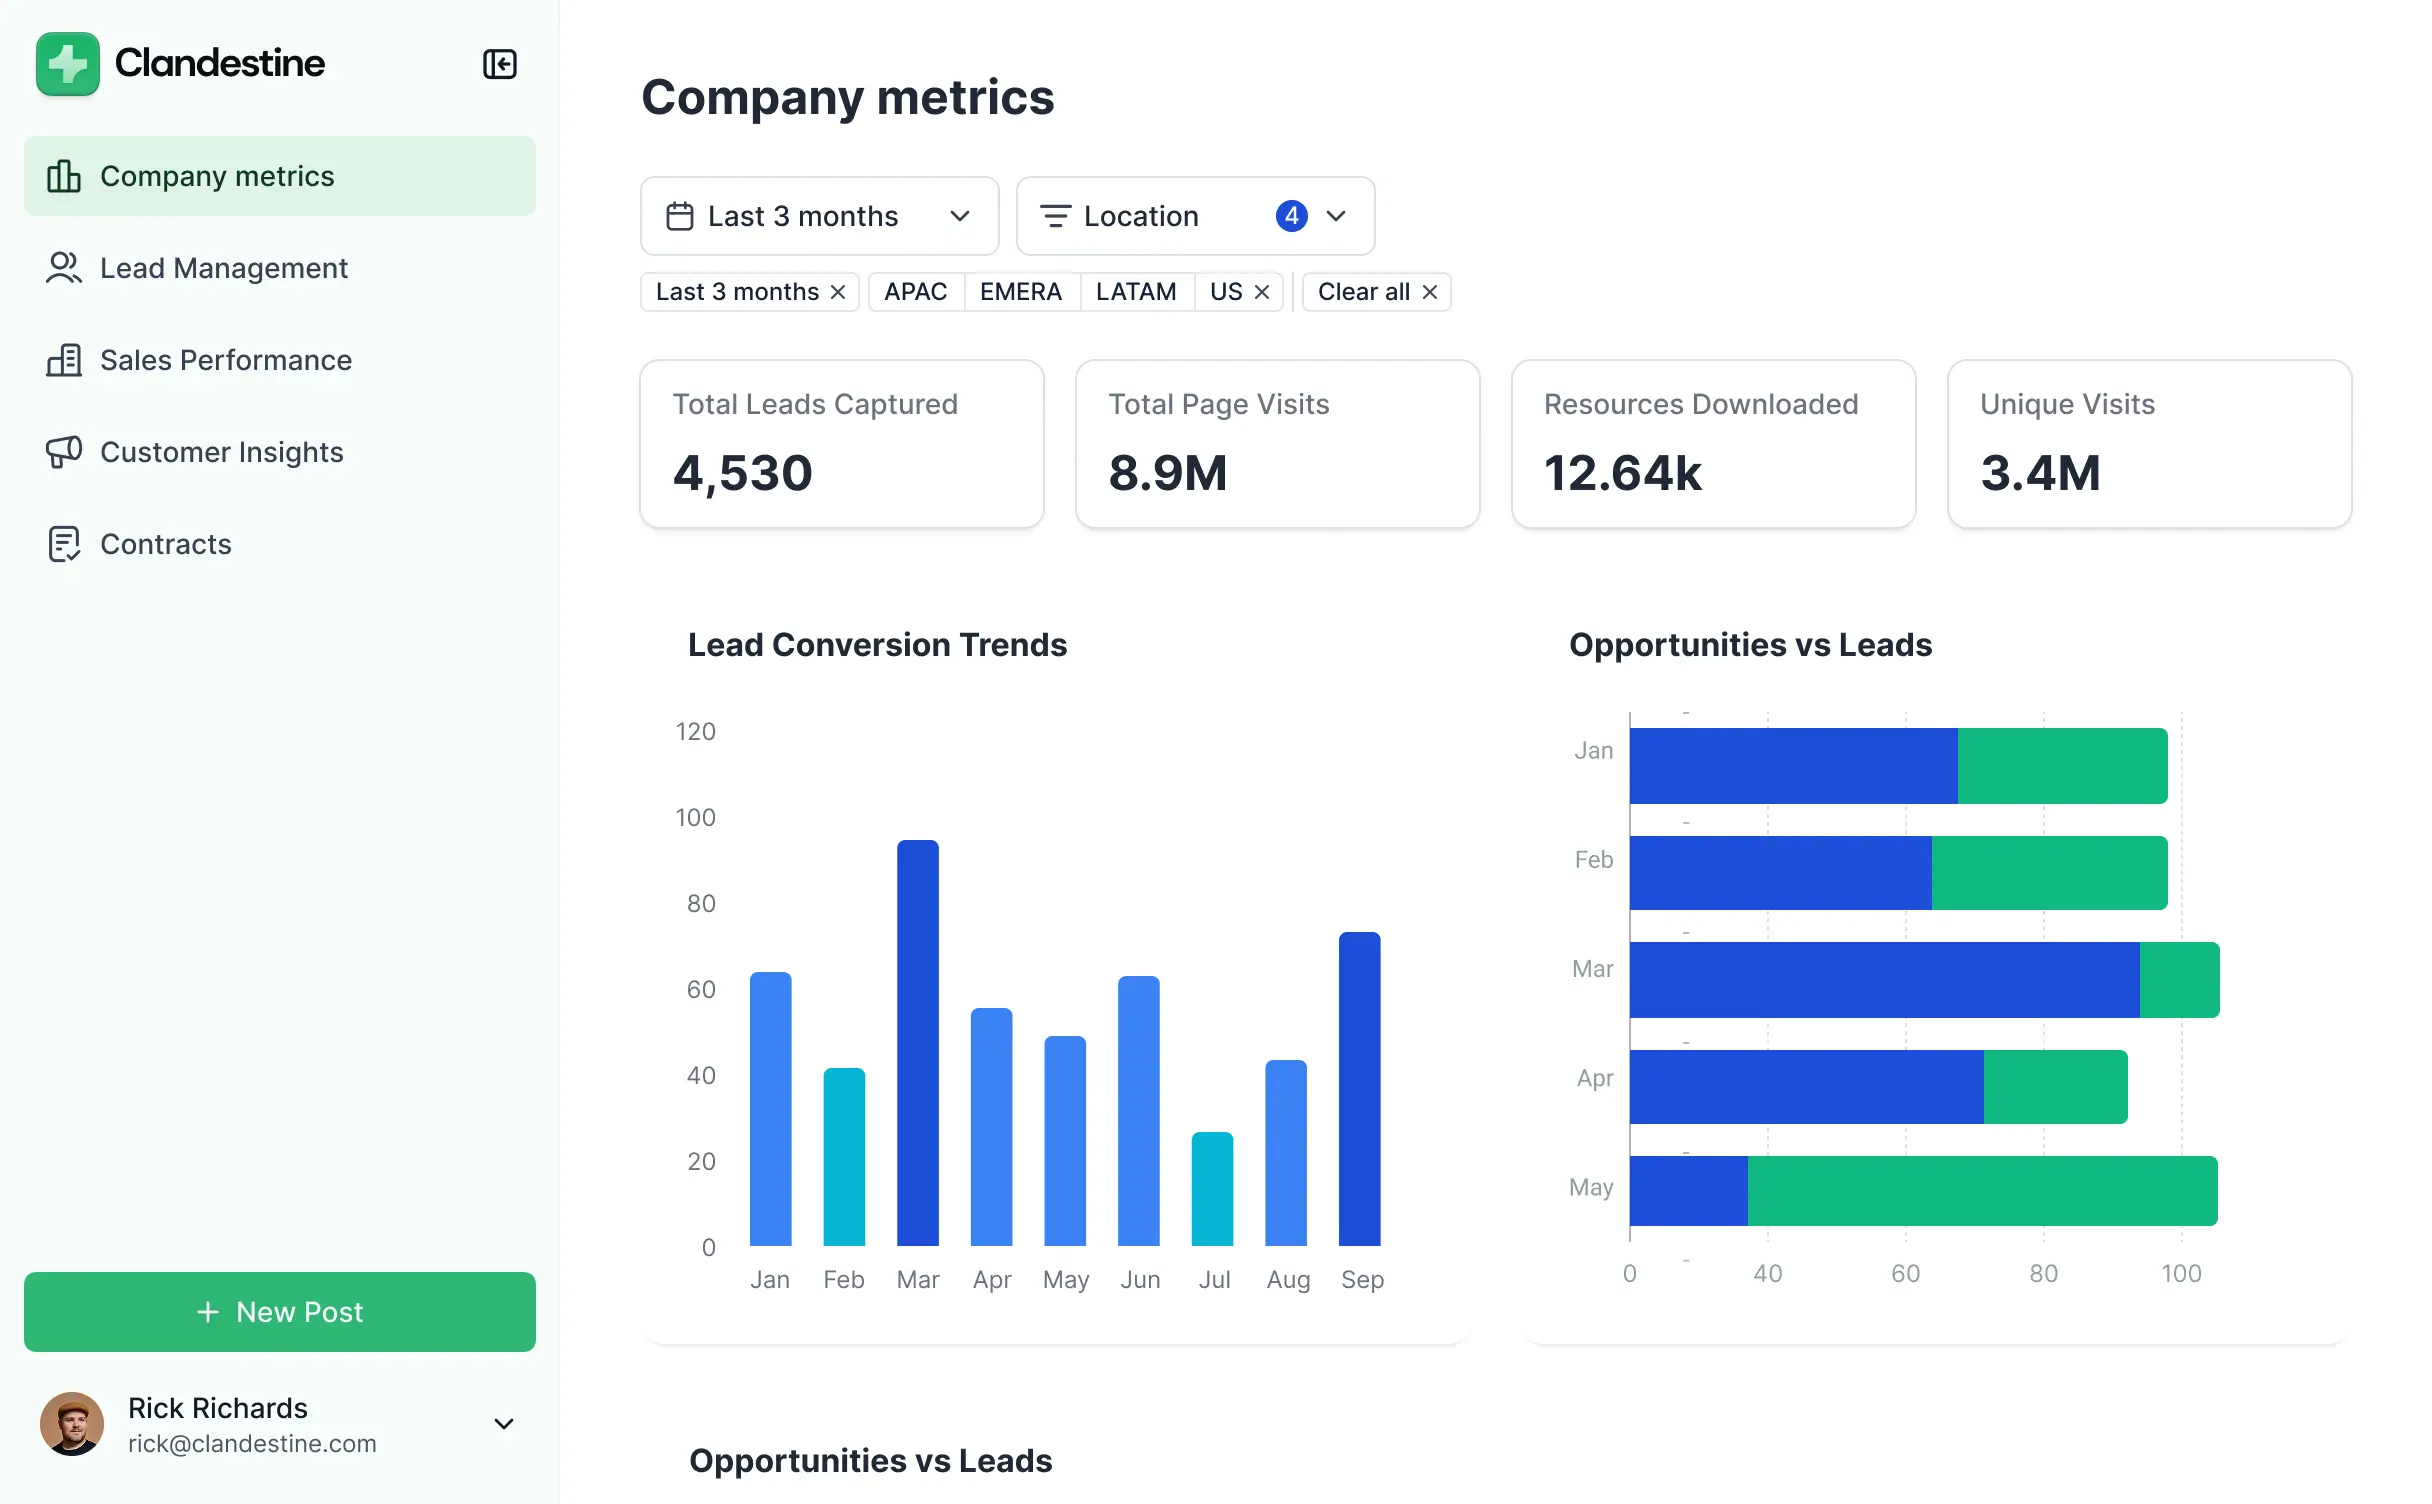
- Dashboards & Charts – Visualize server load, response times, and error rates using real-time line charts, bar graphs, and KPIs.
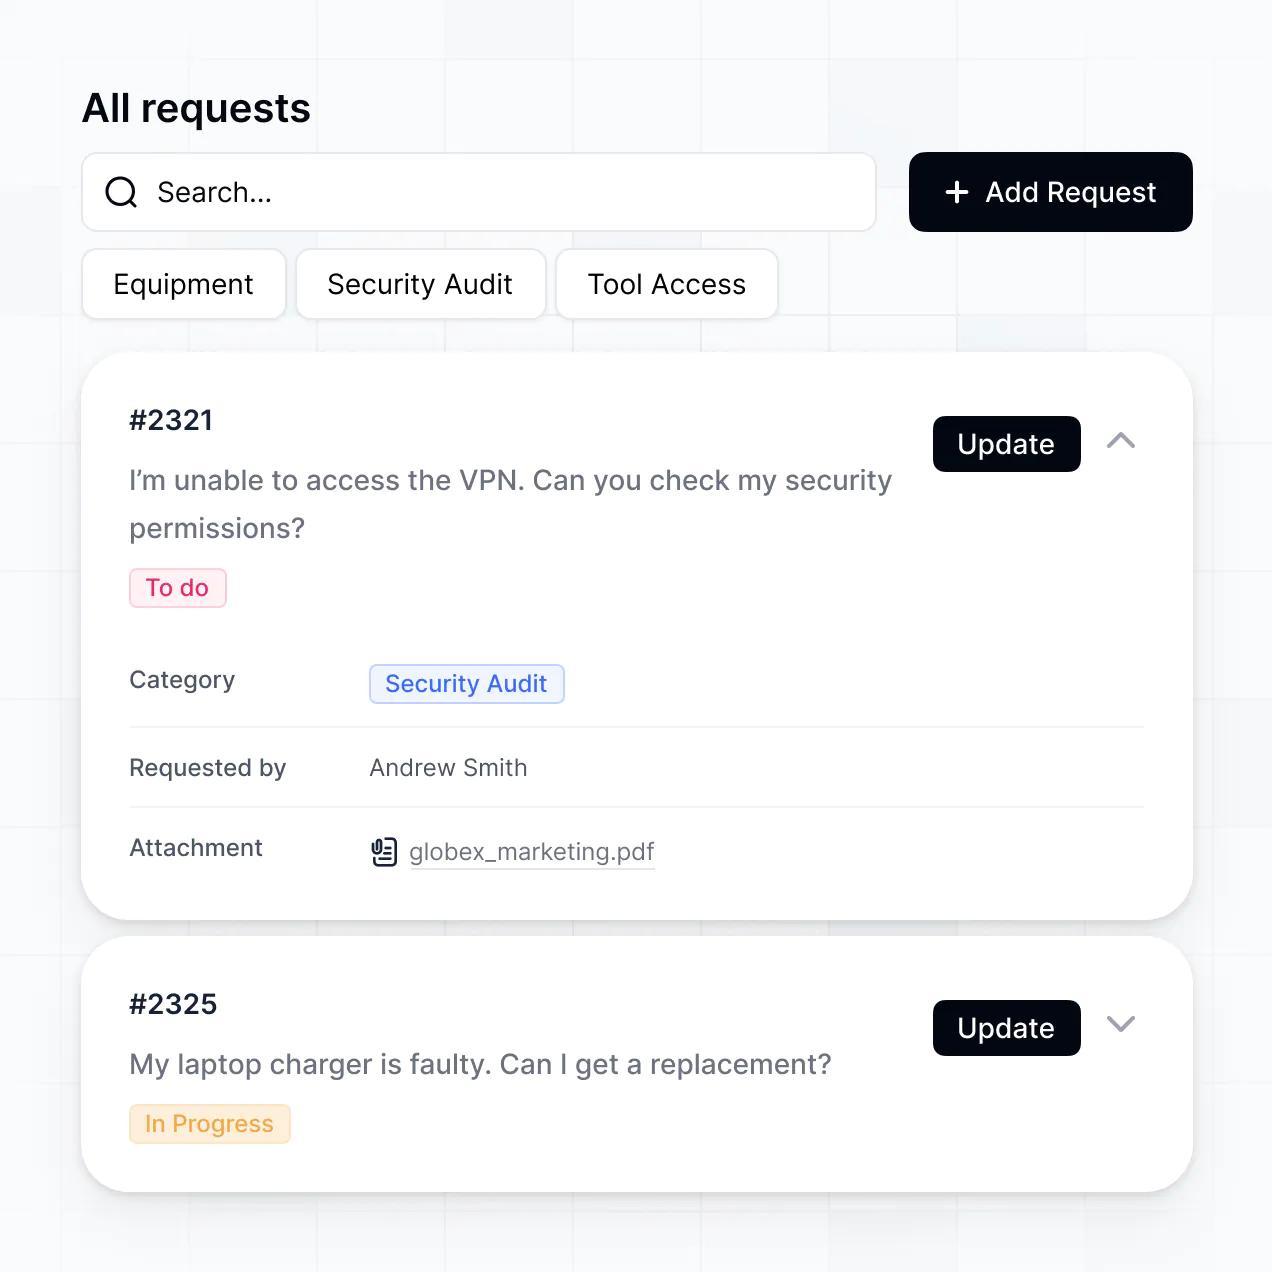
- Lists & Advanced Filtering – Navigate through your entire inventory of servers or microservices using searchable tables and Kanban boards for status tracking.
Every feature is built using drag-and-drop blocks, allowing for professional-grade monitoring without code. If your reporting needs evolve, the Vibe Coding block helps you generate custom visualization logic instantly.
Vibe coding allows you to build sophisticated monitoring tools rapidly by leveraging AI. In Softr, you can "vibe code" your system performance monitoring dashboard by describing your desired metrics and reporting layout to the AI Co-Builder. Softr then generates a structured analytics application on a secure, optimized foundation.
While other tools leave you with raw, unmanaged scripts, Softr provides the essential infrastructure—authentication for your IT team, database connectivity, and security—out of the box. This provides the speed of vibe coding without the operational burden of maintaining custom code. You simply describe the KPIs you care about, and Softr builds a dashboard ready for your operations team immediately.
Yes. You can manage multiple data centers, regions, or engineering teams within one unified dashboard. Using login-based permissions, you can ensure regional leads only see the server performance specific to their location, while CTOs maintain a global overview of all system health.
Yes, you can. You do not need an existing monitoring stack to start building with Softr. For teams starting fresh, Softr Databases provides a built-in relational data source that integrates natively with your dashboard blocks to track server assets and uptime logs.
If you are already collecting data in tools like SQL databases, Airtable, or Google Sheets, you can sync those instantly. You can also utilize the REST API connector to ingest performance metrics from external monitoring APIs. Softr gives you total flexibility in how your system data is structured and presented.
Softr Databases is the recommended native source for your system performance monitoring dashboard, offering the high speed and internal automation triggers required for monitoring apps. Because the data is native, the dashboard experience is incredibly fast and responsive.
Softr also supports over 17 external data sources for teams with existing data. You can connect to SQL, BigQuery, Airtable, or SmartSuite. You can even combine sources—for example, pulling server inventory from Softr Databases and real-time maintenance tickets from HubSpot into the same view. Most integrations support two-way sync to keep your performance records updated in real time.
Yes, Softr provides precise control over how IT staff interact with your monitoring dashboard. You can tailor the navigation and data layout to match your specific DevOps workflow. Every chart or data list can be gated so that only authorized users see sensitive infrastructure details.
You can define granular roles—such as Read-Only Viewer, System Ops, or Admin—and dictate exactly which metrics each role can edit or view. For instance, external stakeholders might only see high-level uptime charts, while internal engineers can drill down into specific error logs.
This customization ensures your monitoring app remains secure and clutter-free, providing relevant data to each team member while protecting critical system settings and private records.
Yes, you can fully white-label your system performance monitoring dashboard. You can apply your own corporate logo, brand colors, and technical styling, and host the dashboard on a custom domain (e.g., status.yourcompany.com). This ensures that your monitoring tool looks like an official internal asset rather than a third-party application.
Yes, you can. Softr offers extensive flexibility to modify the design and layout of your monitoring views. You can configure the UI spacing, typography, and page hierarchy to suit your team’s monitoring needs, ensuring that critical alerts are always front and center.
To visualize your performance data effectively, you can utilize various blocks:
- Table blocks – for listing detailed server inventories and resource logs.
- List or Card blocks – to show the status of different microservices or cloud regions.
- Detail View – for deep dives into a specific server's performance history.
- Forms – for logging incident responses or manual health checks.
- Charts – to visualize CPU, RAM, and Disk usage trends over time.
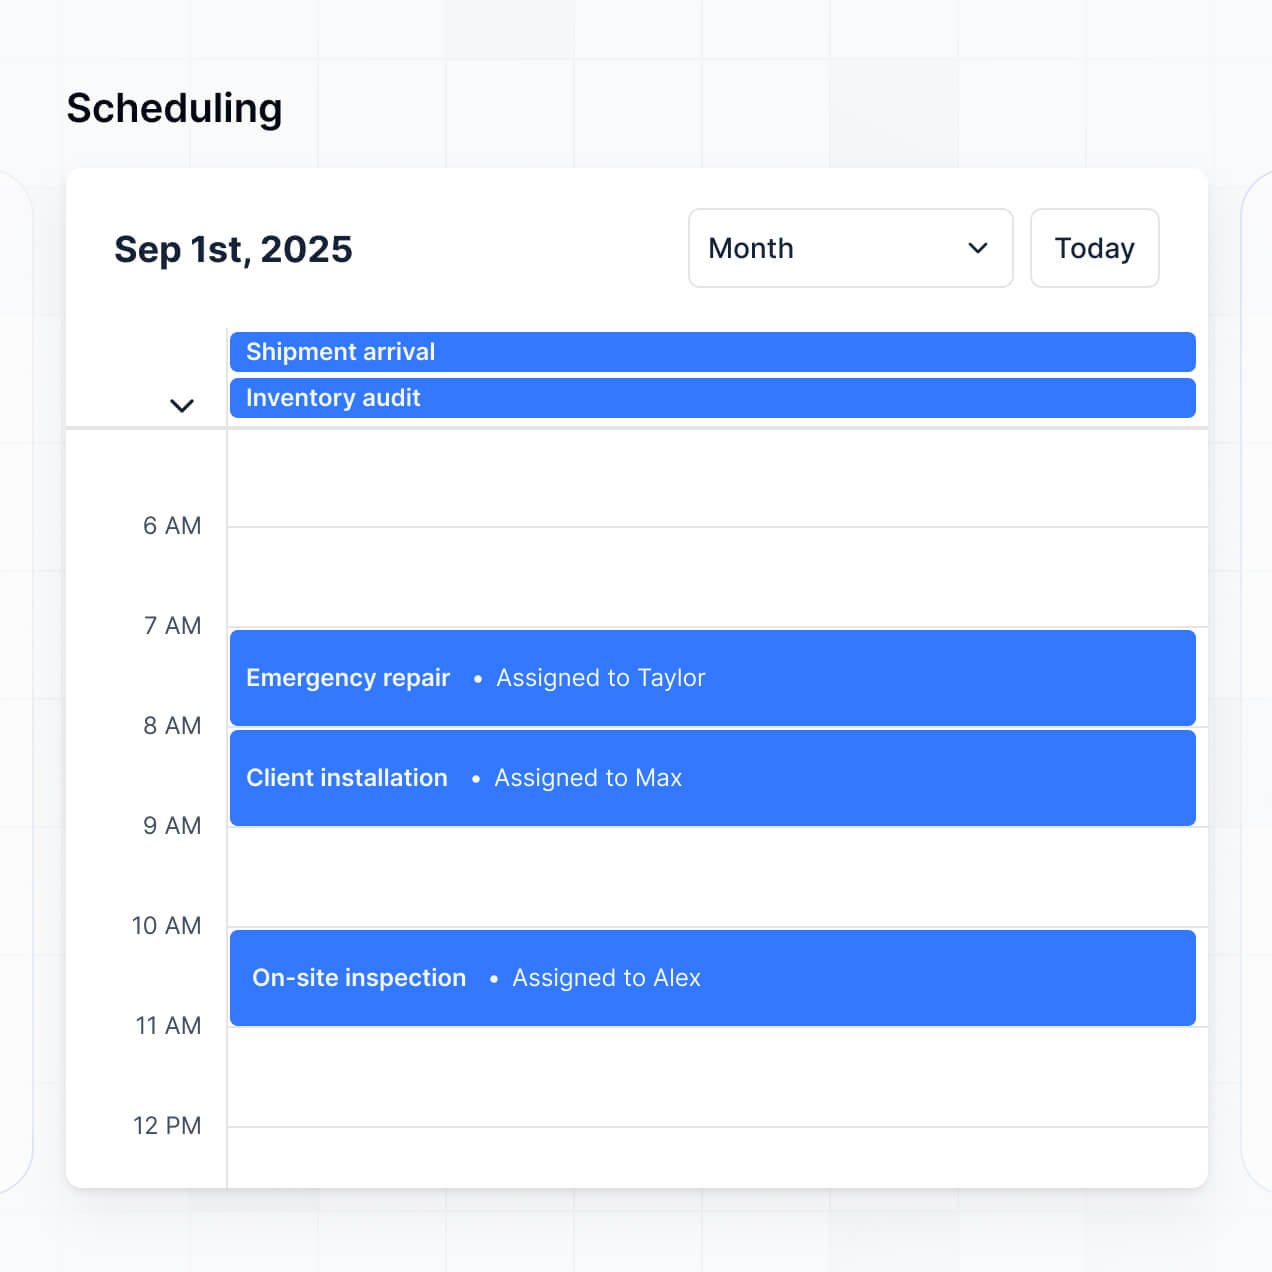
- Calendar blocks – to track scheduled maintenance windows or deployment dates.
If your monitoring requirements change, you can update the dashboard’s structure instantly using the visual editor.
Security is built into the core of Softr. All performance data is encrypted via TLS in transit and at rest, and hosted on reliable infrastructure. You retain complete control over data visibility through role-based permissions and global visibility rules, ensuring sensitive infrastructure data is never exposed to unauthorized users.
For apps using Softr Databases, data is stored in a secure European (German) environment with SOC 2 Type II compliance. For apps pulling from external SQL or BigQuery sources, Softr acts as a secure presentation layer and does not store your raw performance data. You are always the owner of your infrastructure data and control who can access or modify it.
It is absolutely production-ready. While many AI products generate unoptimized code that is difficult to secure, Softr builds your system performance monitoring dashboard on a stable, enterprise-grade architecture.
We provide the essential native layers—like secure authentication and granular access control—so your team can skip the foundational setup. This approach allows you to benefit from the speed of AI generation while maintaining a scalable and secure application that your operations team can rely on from day one.
Softr is the first AI-native platform designed for custom business software. Unlike traditional BI tools that are static or manual no-code platforms that require weeks of configuration, Softr's AI Co-Builder generates a functional monitoring application on a secure, production-ready foundation in minutes.
The key advantage is the hybrid approach: generation speed combined with visual precision. You get the power of AI to create the initial database and dashboard logic, with the ability to fine-tune every permission and chart visually. It is built for IT teams who need professional internal tools without the development overhead.
Yes. Softr supports robust native workflows and a variety of integrations to connect your dashboard with your IT stack. You can automate monitoring tasks using Softr Workflows or integrate with tools like Stripe for billing or Intercom for support. Softr also provides a REST API and webhooks for advanced DevOps integrations.
Whether you need to trigger a PagerDuty alert based on a dashboard button click or sync server data from an external cloud provider, you can build these automated connections without writing code.
Go from idea to live dashboard in under an hour. Build and customize your system monitoring without code.