Visualize key metrics and generate reports in an AI-powered system built with AI you customize to fit your executive team's workflow.

Customize your setup with the exact charts and tracking views your team needs. Add features as workflows evolve—no code or training required.


Connect spreadsheets, CRMs, and other systems with real-time sync—or manage everything in Softr Databases. Create a single source of truth for your business.
Give each teammate the right tools and access. Set up secure logins, user groups, and granular permissions—no IT support or dev work needed.
Give different department heads tailored access and personalized dashboards, so each role sees only the data points that matter to them.
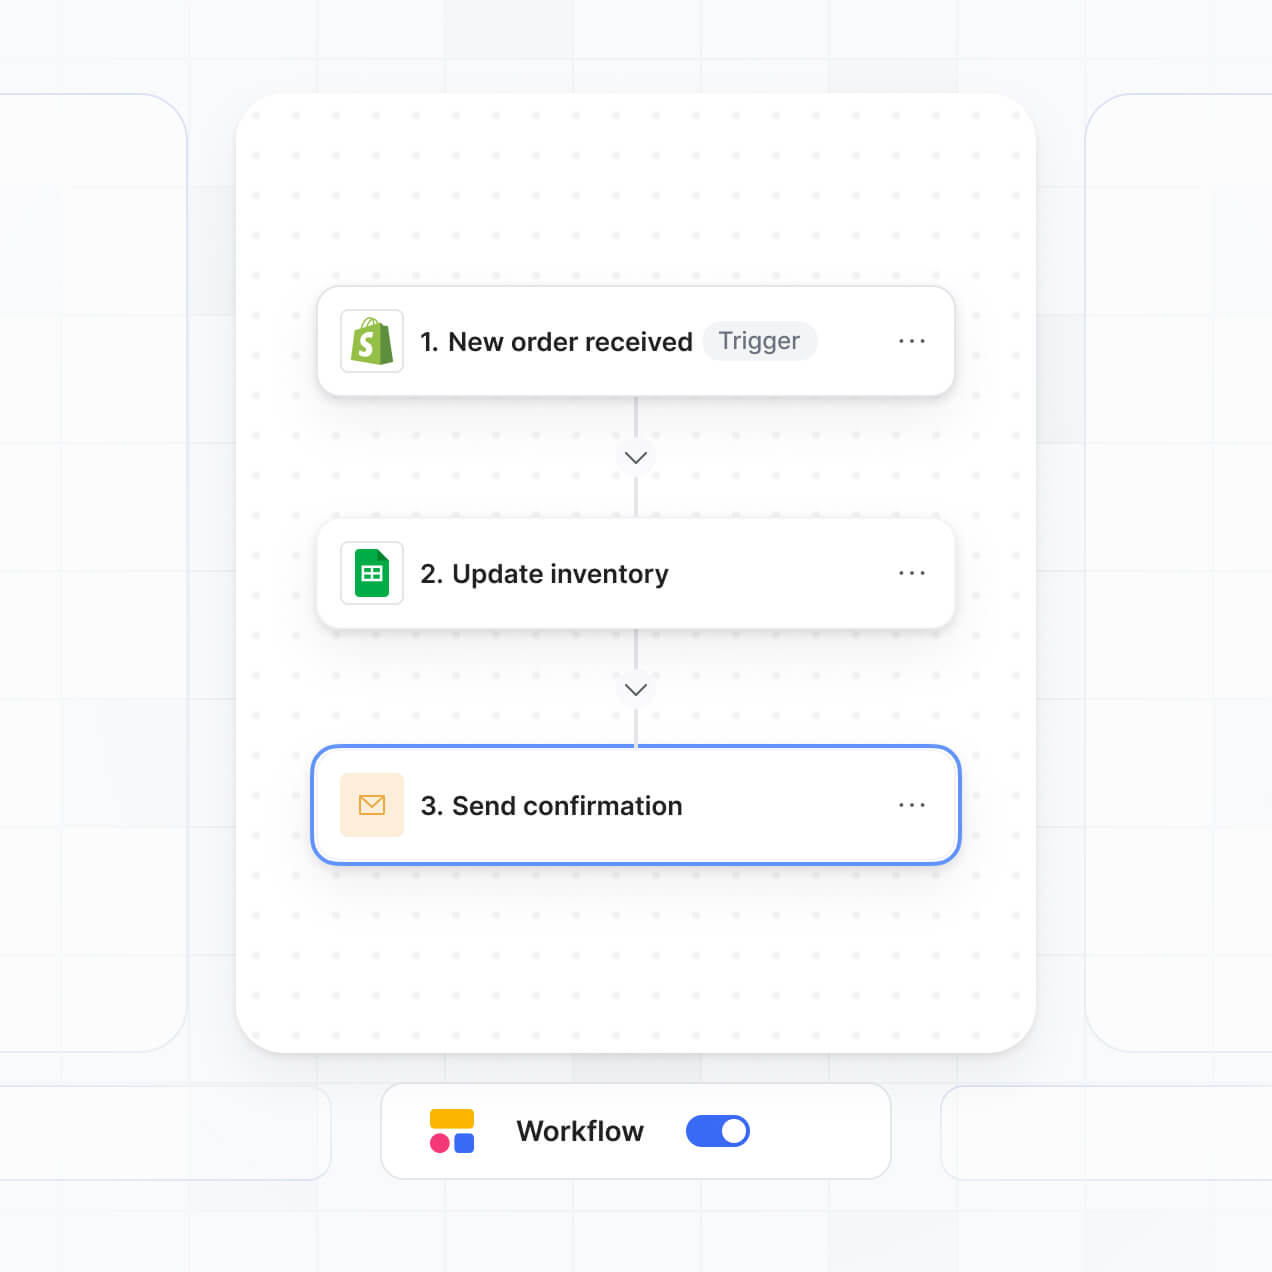
Streamline your reporting with Softr Workflows. Trigger native notifications or status updates based on goal changes to keep operations moving.
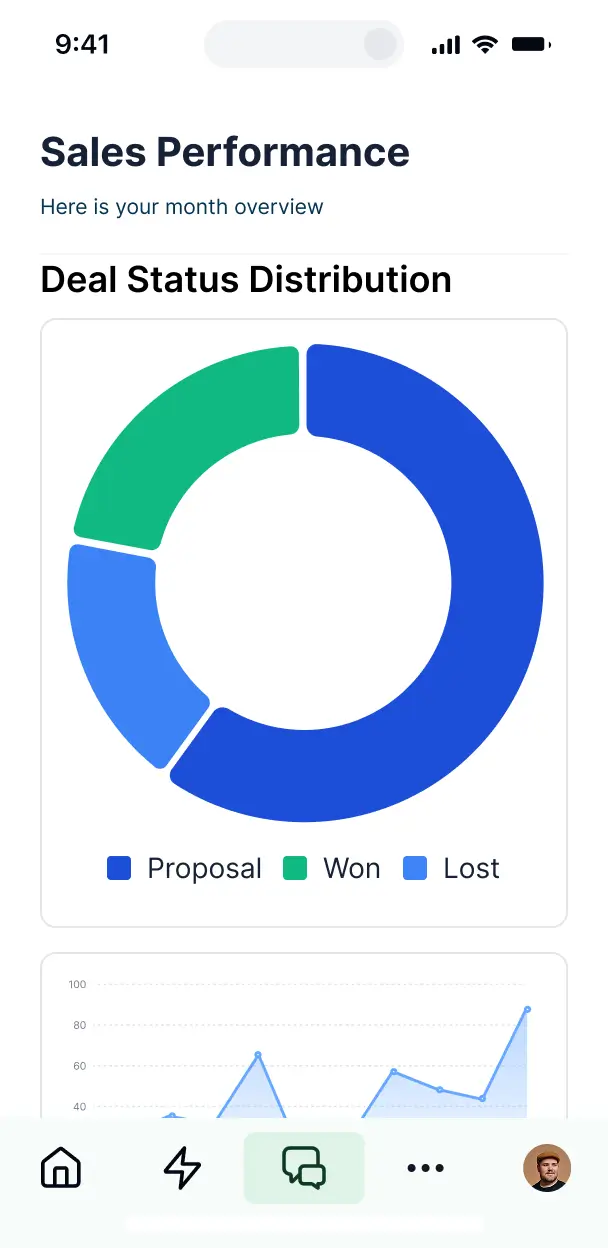
Access and update your dashboards and decision tools on the go. All reporting apps are mobile-ready out of the box for executive use.
Use Google, email, or SSO logins to give your team fast, secure access to private company metrics—no IT department tickets needed.
Keep sensitive business data safe with SOC2 and GDPR compliance, plus fine-tuned access control at every level of your dashboard.
No more one-size-fits-all tools or costly custom builds. Softr is easy to use and fully customizable, so you can launch faster, adapt as you grow, and skip the complexity of traditional software.

Build your decision tool in minutes with AI—no manual configuration or complex data mapping needed.

Add features like budget tracking or executive approvals as your team's needs evolve—without starting from scratch.

Start with dashboards, then add internal forms or project tools—all in one place with no extra seats to buy.
Co-build with AI
Simply describe what you need. Let Softr handle everything - Interface, database, workflows.
Iterate with AI or visually
Control most critical parts of your app yourself - roles, permissions, security.
Ship the same day
Invite team members or external clients and partners right away. No developer handover.
Use drag-and-drop blocks to build a portal that looks sleek and modern out of the box. Add only the features you need, and iterate as your workflows evolve.




A data driven decision making tool is a centralized dashboard and reporting hub where your team can access real-time analytics, KPIs, and operational trends. It transforms raw business data into actionable insights, moving beyond gut feelings to objective strategies. By housing all your metrics in one place, you eliminate data silos and ensure every department—from marketing to finance—is aligned on the same evidence-based goals.
Softr is the first AI-native platform for building business software, making it the fastest way to build a data driven decision making tool that fits your specific reporting needs. You can describe your KPIs and visualization requirements to the AI Co-Builder to instantly generate your data structure, analytics pages, and filtering logic—already connected and secure.
You don't need to code anything. You can start by generating with AI, using a dashboard template, or building from scratch. Everything runs on Softr Databases, or you can sync external data from tools like Airtable, Google Sheets, or SQL databases. You have full control to customize charts visually, manage permissions for executive vs. manager views, and brand the dashboard to match your corporate identity. It's quick to launch, easy to iterate as your strategy changes, and scales as your data grows.
You can include a wide range of features to support robust analysis, depending on your reporting volume. A high-impact data driven decision making tool usually blends classic reporting blocks with AI-powered analytics:
- AI-Powered Intelligence – Use Ask AI to let executives query their sales or churn data conversationally, or set up Database AI Agents to perform automated anomaly detection or impact analysis.
- Vibe Coding Blocks – Build complex, custom UI elements—like a multi-series trend comparison chart—using the AI Code block to "vibe code" exactly the visualization you need.
- Softr Workflows – Build native automations (like an alert sent to Slack when a KPI falls below a certain threshold) that trigger whenever your underlying data is updated.
- User Portals & Logins – Securely manage access so regional managers only see data for their specific territory while leadership maintains a global view.
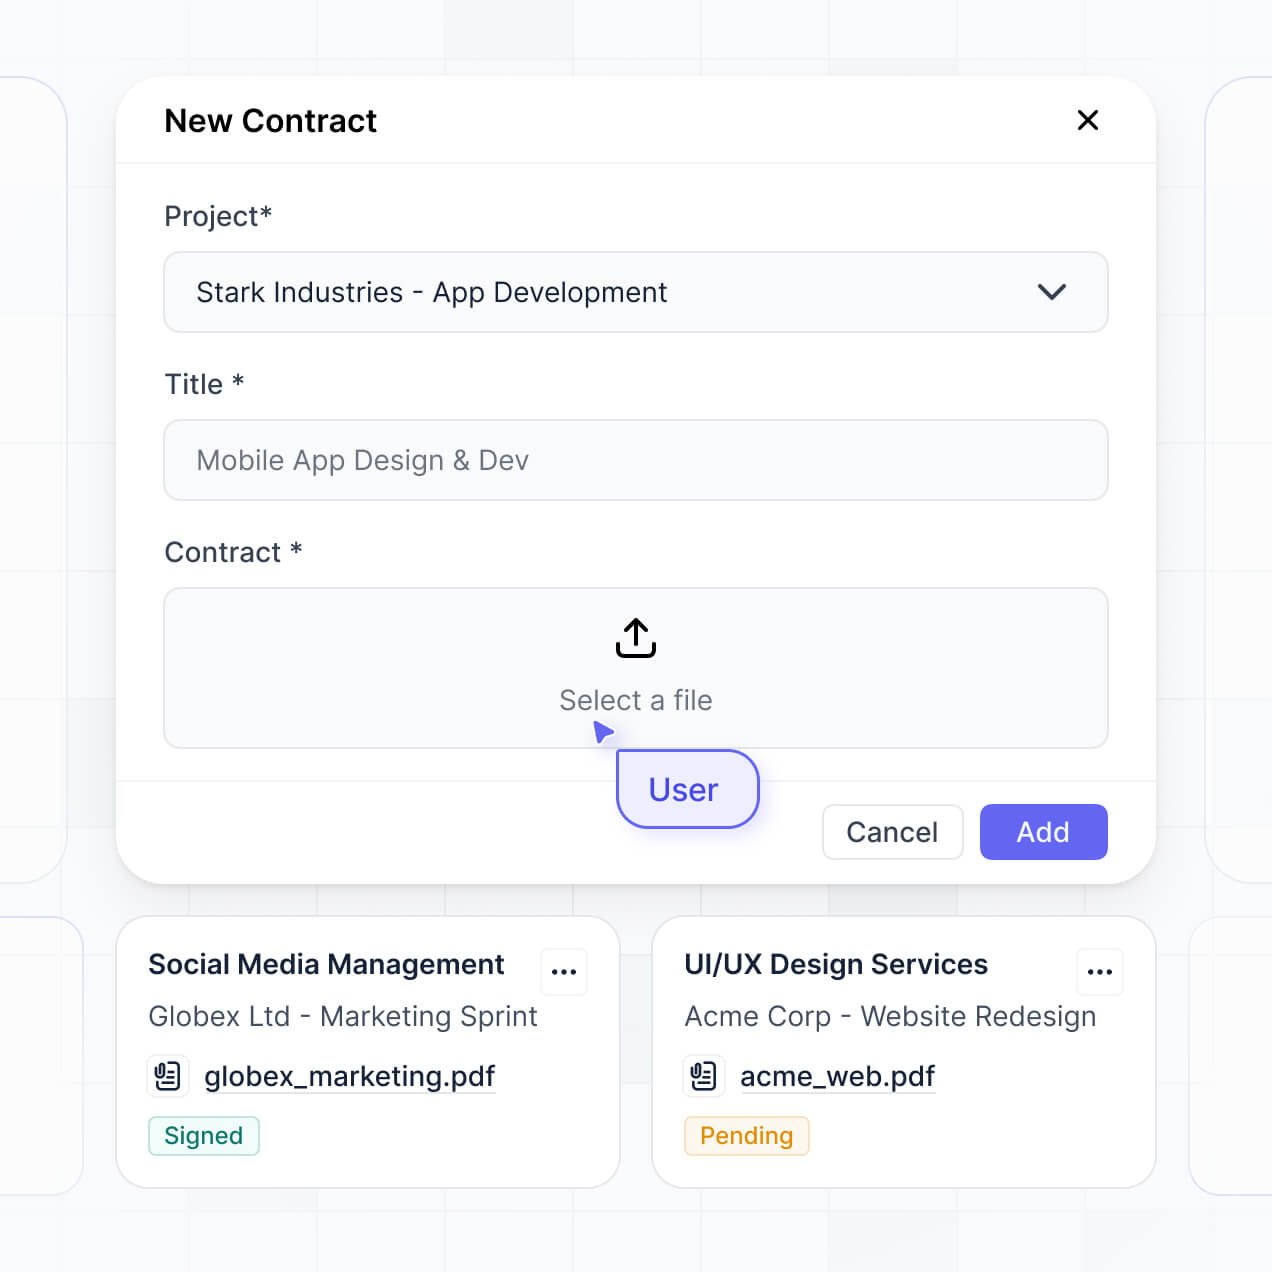
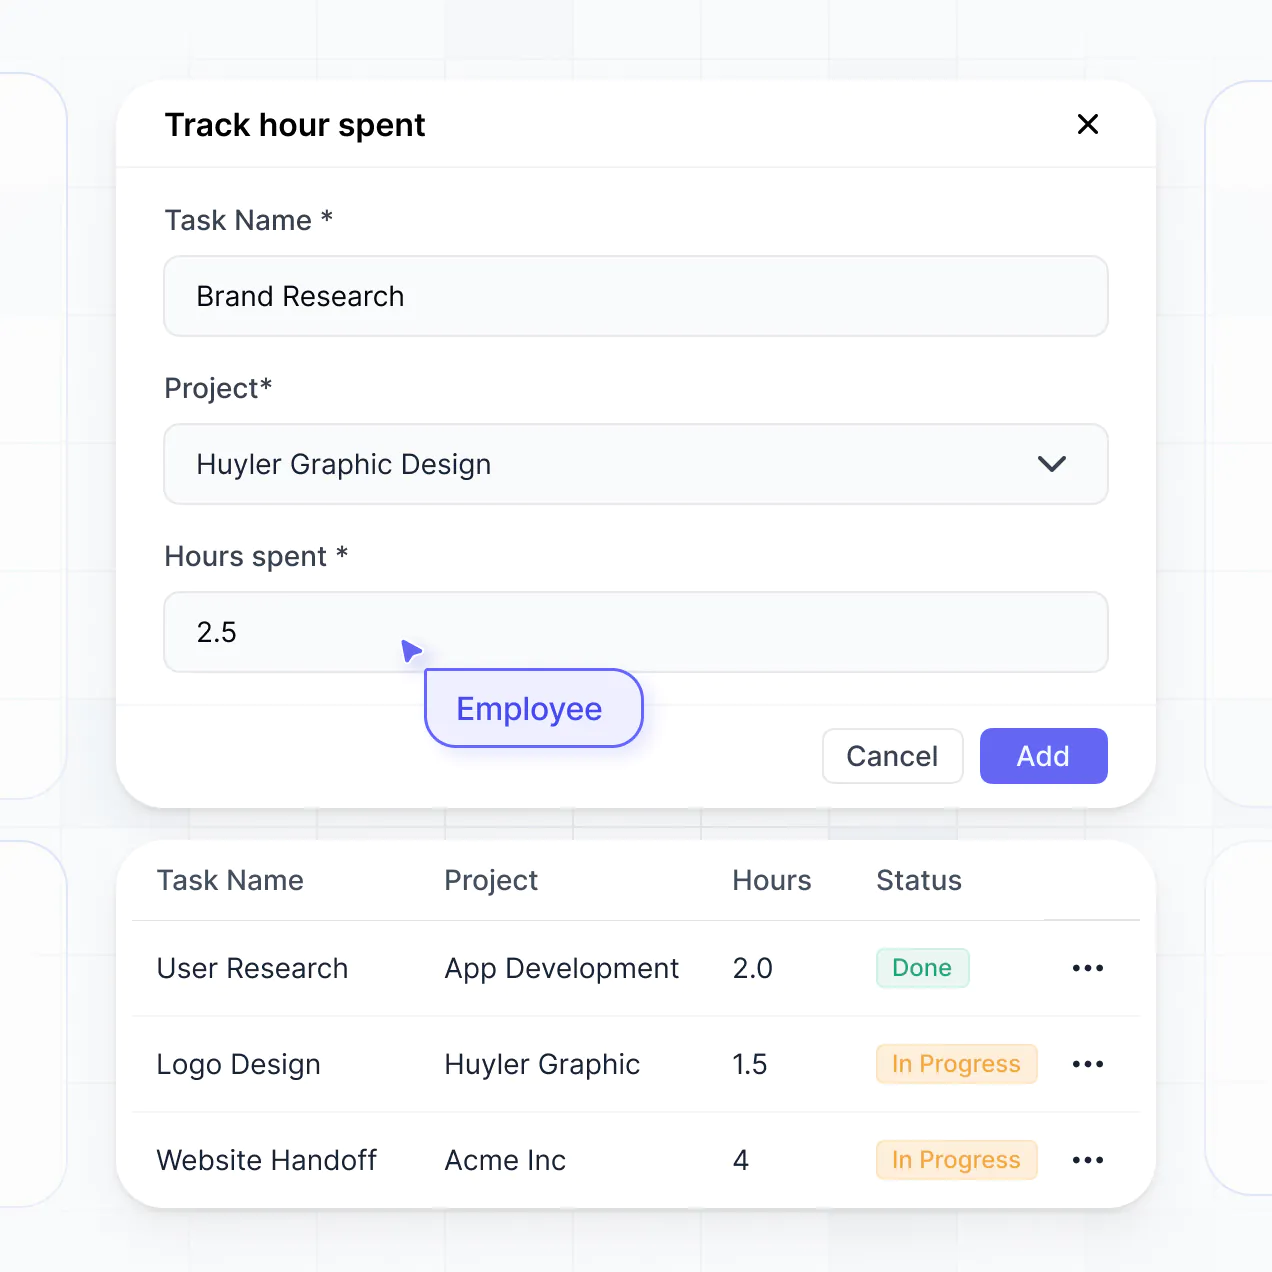
- Forms & Data Collection – Capture qualitative feedback or manual data entries with custom forms and conditional logic.
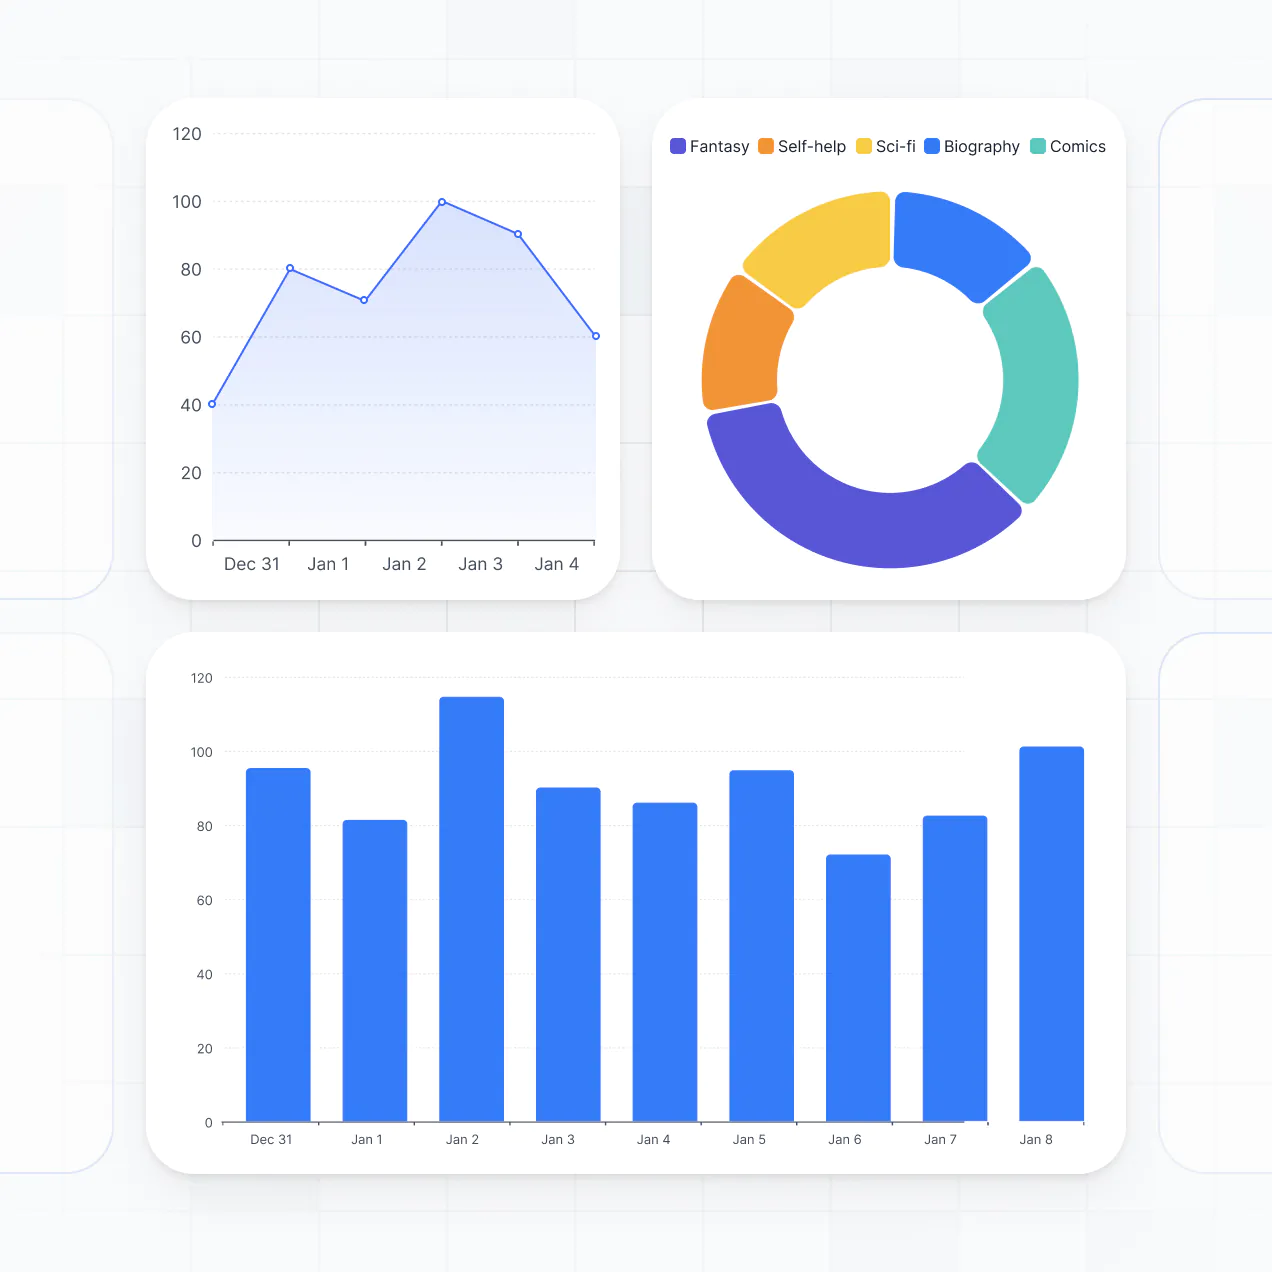
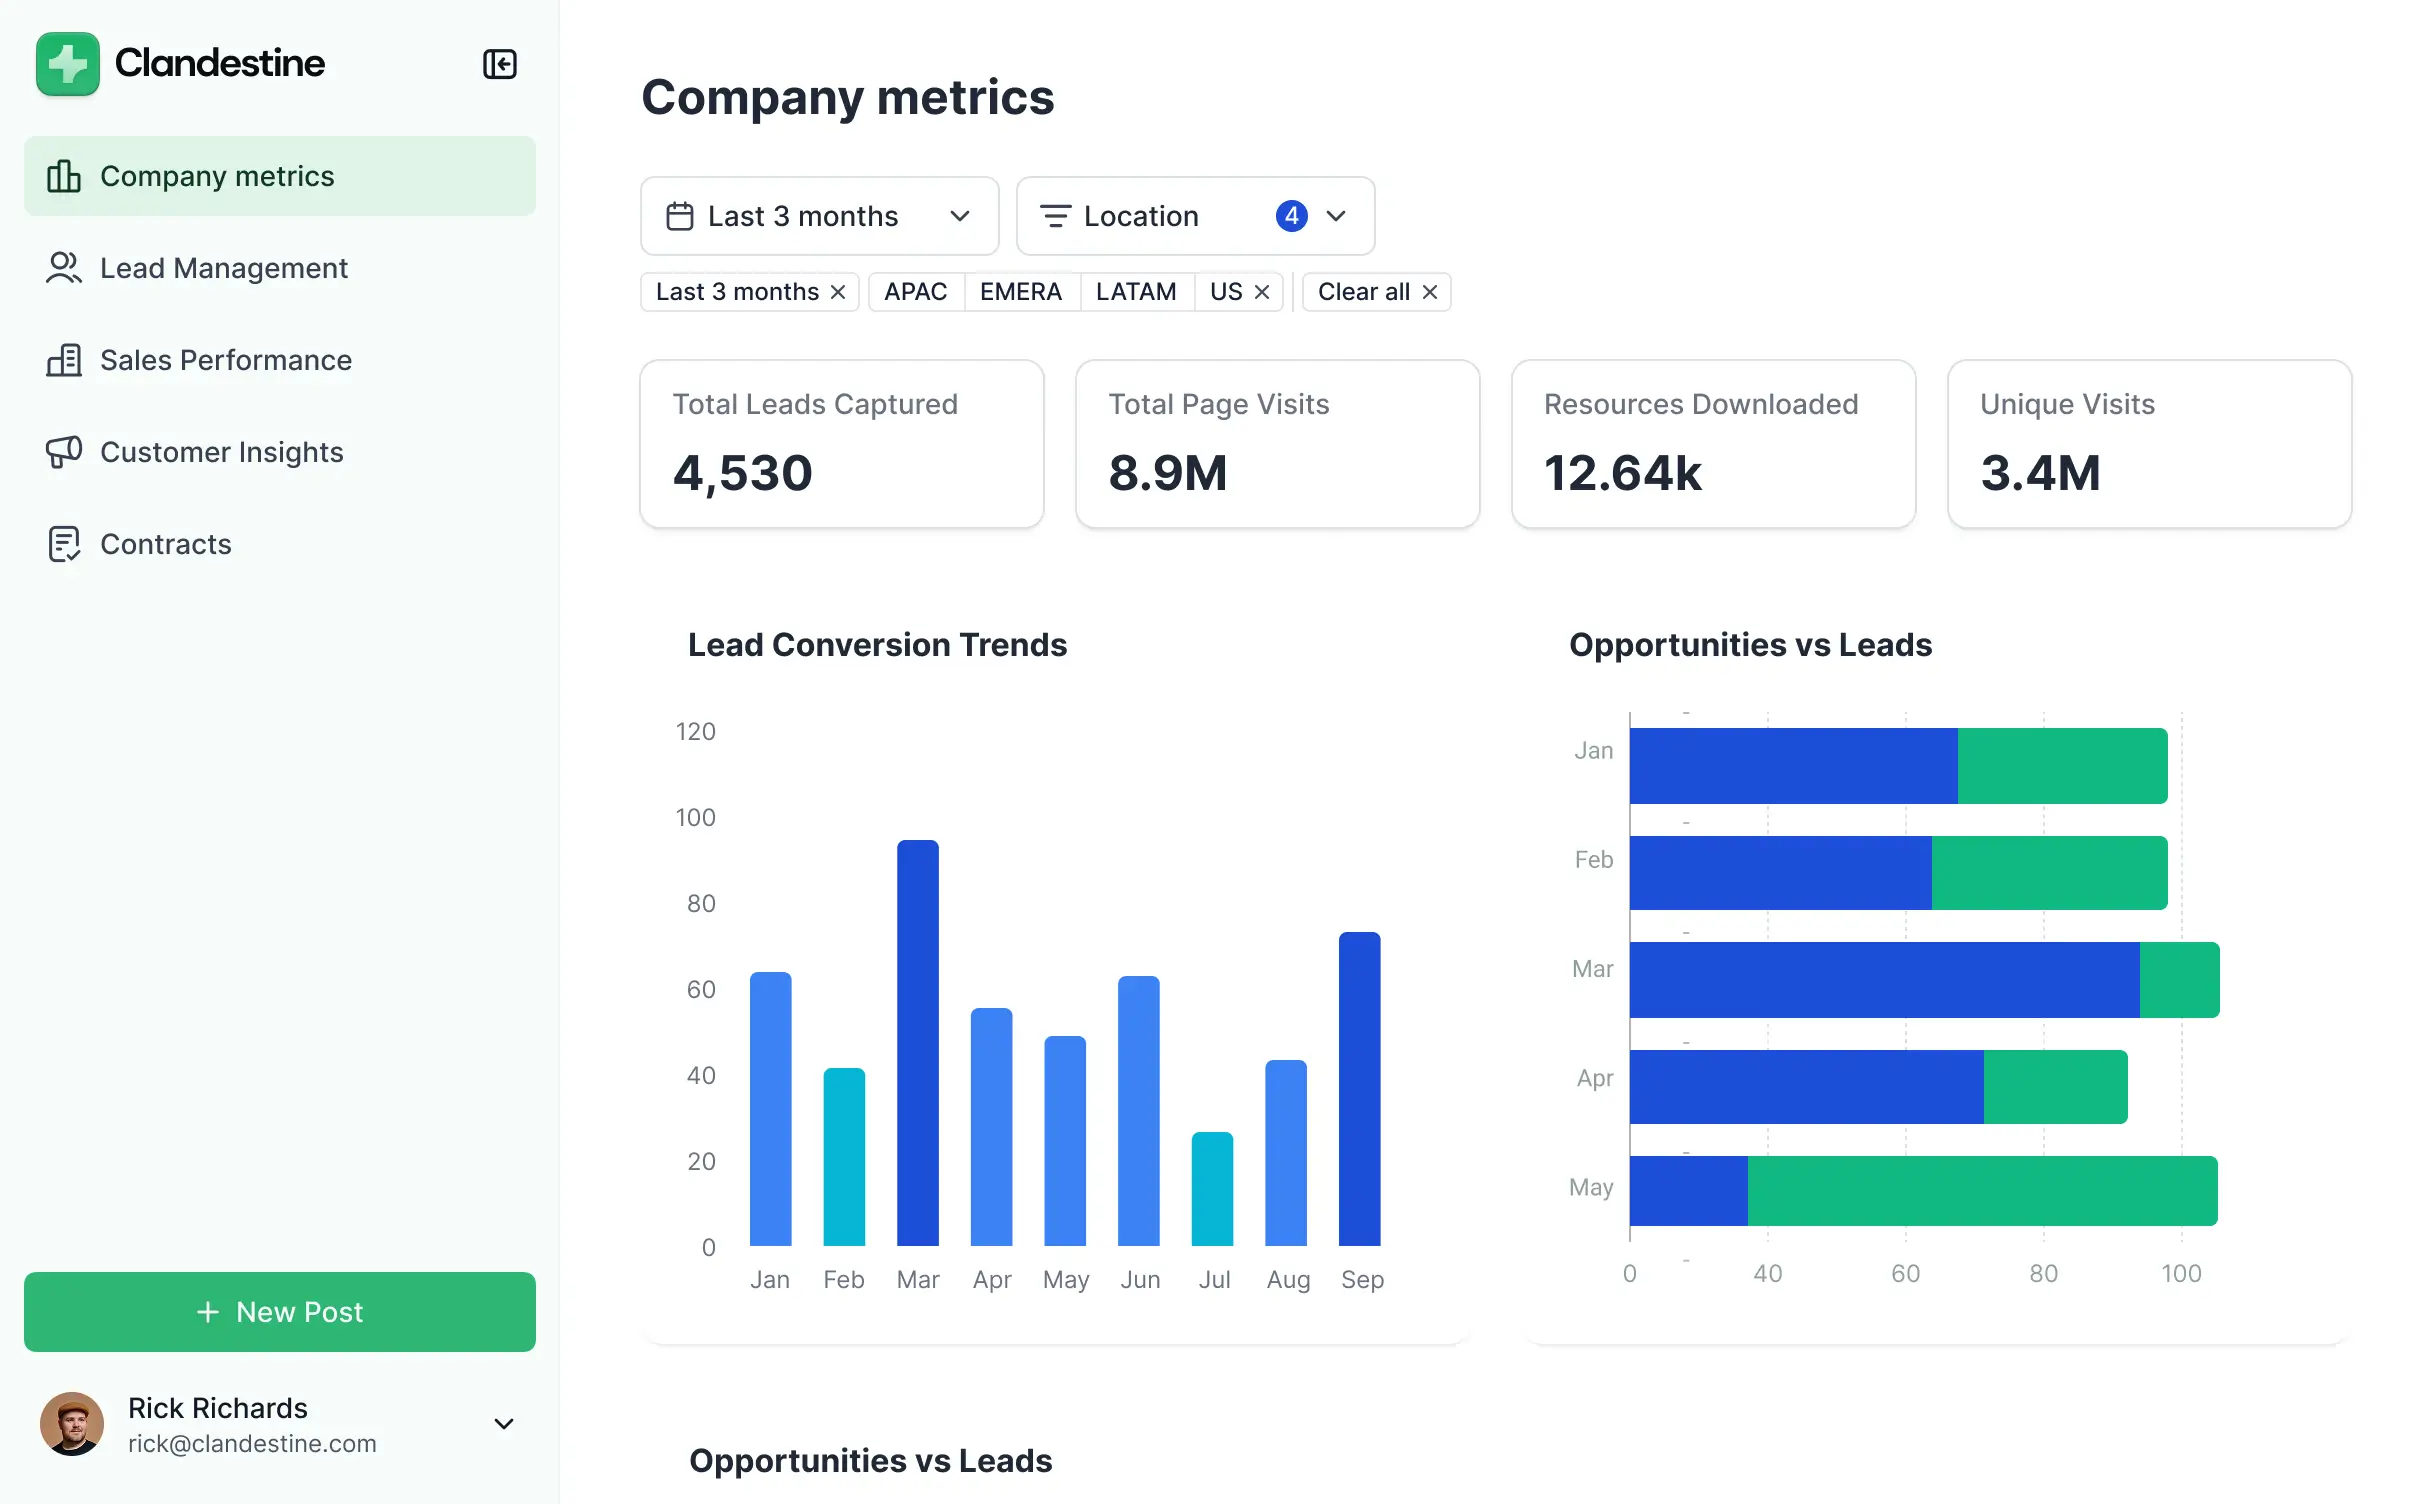
- Dashboards & Charts – Visualize revenue, conversion rates, and growth metrics with real-time bar graphs, line charts, and summary cards.
- Lists & Advanced Filtering – Drill down into specific rows of data with searchable tables and sophisticated date-range filters.
Everything is built using Softr's drag-and-drop blocks without writing code. If you need a specialized financial model, use the Vibe Coding block to generate it with AI.
Vibe coding is all about moving fast and using AI to build the exact reporting interface you need. You can "vibe code" a data driven decision making tool in Softr by simply describing your metrics and desired layouts to the AI Co-Builder. Softr then generates a production-ready dashboard on top of a stable, secure foundation.
Unlike other tools that just generate raw, fragile code, Softr handles the "boring 80%"—like data authentication, relational logic, and visualization security—natively. This means you get the speed of vibe coding without the technical debt of managing raw frontend scripts. You describe the insights you need, Softr builds the dashboard, and it’s ready for your stakeholders instantly.
Yes. You can manage multiple departments or branch offices within a single analytics portal. Each stakeholder only sees the performance data and charts assigned to their specific department or region, based on their login credentials. This is ideal for large organizations or franchises that want a unified reporting standard with segmented data access.
Yes, you can. You don't need to bring your metrics from an external source to start building with Softr. If you are starting your data collection from scratch, you can use Softr Databases, which is built into the platform and allows you to structure your reporting architecture directly alongside your dashboard.
However, if your data is already stored in tools like Airtable, Google Sheets, HubSpot, or even a SQL database, you can connect those seamlessly. You can also use the REST API to ingest data from other SaaS platforms. Either way, you have absolute control over how your metrics are calculated and visualized for your decision-makers.
Softr Databases is the recommended native data source for building high-performance data driven decision making tools. It is built for business apps, offering instant triggers for dashboard updates and a lightning-fast experience because the reporting data is native to the platform.
If your data resides elsewhere, Softr also connects to 17+ external sources including Airtable, Google Sheets, BigQuery, and HubSpot. You can even combine multiple sources in one dashboard—for example, pulling financial data from a SQL database and marketing spend from HubSpot. Most sources support real-time, two-way sync, ensuring your decisions are always based on the most current data.
Yes, Softr gives you full control over how your team interacts with the decision-making tool. You can customize the dashboard layout and navigation to match your internal reporting standards. Each chart or data block can be shown or hidden based on roles, ensuring an Analyst sees granular tables while an Executive sees high-level summaries.
You can set up granular user roles—such as Admin, Manager, or Viewer—and define precisely what each role can view or export. For example, marketing leads can see campaign ROI, while the finance team sees the broader balance sheet. You can also create personalized views by automatically filtering dashboard data based on the logged-in user’s department.
This customization ensures your data tool stays clean and secure, providing only the relevant insights to the right people at the right time.
Yes, you can fully white-label your data driven decision making tool in Softr. You can use your corporate logo, custom color palettes, brand fonts, and a custom domain to ensure the dashboard feels like an official internal application. You can also remove all Softr branding so your team experiences a professional, unified interface built entirely on your company's identity.
Yes, you can. Softr provides immense flexibility to control the visual flow and structure of your decision-making dashboard. You can adjust the themes, block spacing, and page hierarchy to optimize for clarity and data density. You can choose which analytics blocks to prioritize on the primary screen for maximum impact.
To show your data effectively, you can add specialized blocks:
- Table blocks – for exploring detailed line-item data like sales orders or ledger entries.
- List or Card blocks – to highlight top-performing products or key account profiles.
- Detail View – to drill deep into a single specific metric or project status.
- Forms – to allow users to input goals or qualitative commentary.
- Charts – to visualize trends, market share, or budget utilization.
- Calendar blocks – to track reporting deadlines or campaign launches.
If your KPIs change or you need to add a new reporting section, updates can be made instantly in the visual builder without downtime.
Softr is built with enterprise-grade security for your business intel. All data is encrypted in transit and at rest, and your dashboards are hosted on secure infrastructure. Softr gives you sovereign control over data visibility; you can set role-based permissions, manage user access levels within your data source, and apply global restrictions to protect sensitive financial or personal data.
For dashboards using Softr Databases, your data is stored in a secure European (German) environment with SOC 2 Type II compliance. For apps pulling from Airtable or SQL, Softr doesn't store your proprietary records—it simply renders them in real-time based on your permission settings. You always retain ownership and control over who can view or modify your data.
It is fully production-ready. While many AI generators produce fragile, one-off scripts, Softr builds your data driven decision making tool on a stable, scalable foundation. We handle the complex infrastructure like authentication, hosting, and field-level permissions natively.
This solves the common AI "Day Two" problem: you get the speed of instant generation with the reliability of a platform that won't break when your data volume increases. Your dashboard is ready for serious business analysis and executive-level reporting from day one.
Softr is the first AI-native platform specifically for building business software. Unlike simple BI tools that are limitied to static charts, or complex no-code tools that require weeks of training, Softr’s AI Co-Builder creates functional dashboards with full user management and logic in minutes.
The hybrid advantage is key: use AI to generate your metrics database and reporting pages instantly, then use the visual editor for exact refinements. You get the velocity of AI combined with the security features (SSO, roles, granular permissions) required for professional business data, making it the best choice for teams moving from manual spreadsheets to automated software.
Yes. Softr supports powerful native workflows and deep integrations to connect your data tool to your entire tech stack. You can automate decision-triggering tasks using Softr Workflows, or connect to external tools like Slack for notifications and Stripe for real-time revenue data. Softr also supports webhooks and the REST API for complex data pipelines.
Whether you need to automatically update a sales record, trigger an email when a project reaches a milestone, or ingest data from third-party APIs, you can build these automated decision loops directly into your dashboard without writing a single line of code.
Go from raw data to a live reporting dashboard in under an hour. Build and customize your tool without code.