Describe the metrics you need, get a dashboard with live data, secure access, and hosting that holds up for real users today.
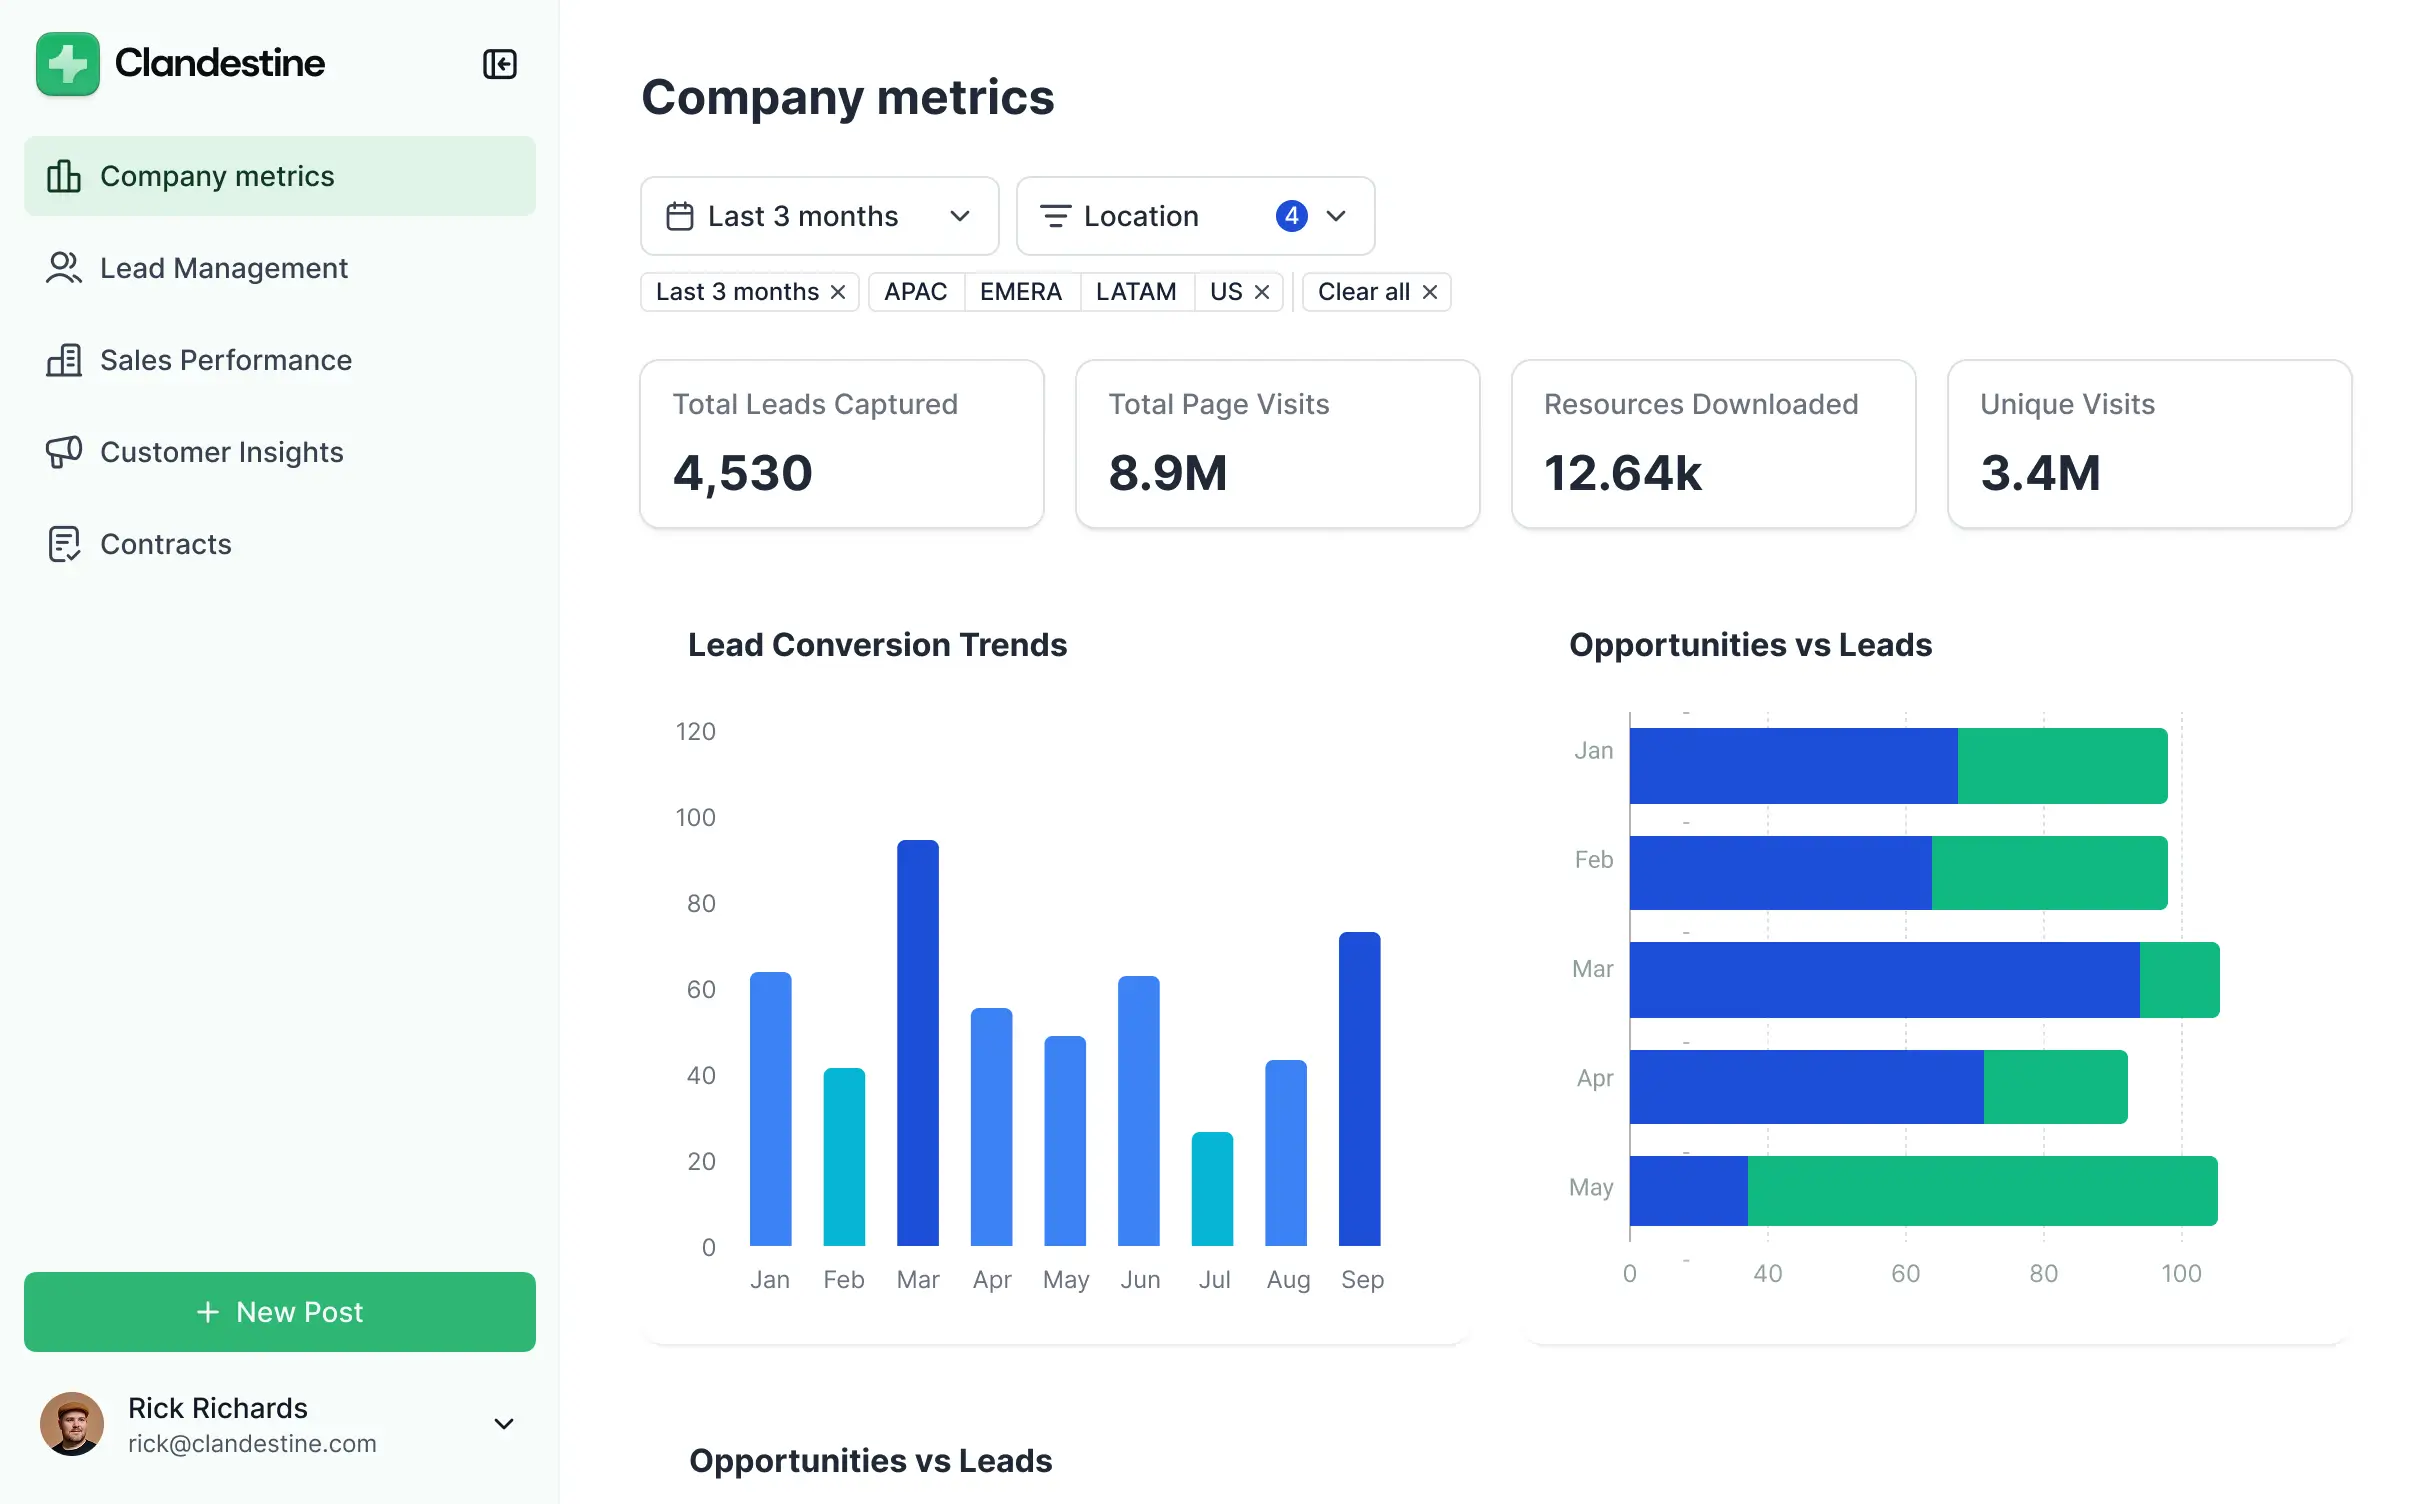

Choose only the views and workflows your dashboard needs today. Customize KPI reporting now, then adapt as your metrics and reporting change.


Connect spreadsheets, CRMs, and other systems with real-time sync, or manage everything in Softr Databases. Create a single source of truth for your reporting.
Give each teammate the right dashboard views and access. Set up secure logins, user groups, and granular permissions, no dev work needed.
Give different teams tailored dashboards and reporting views, so each role sees the metrics and data they need.
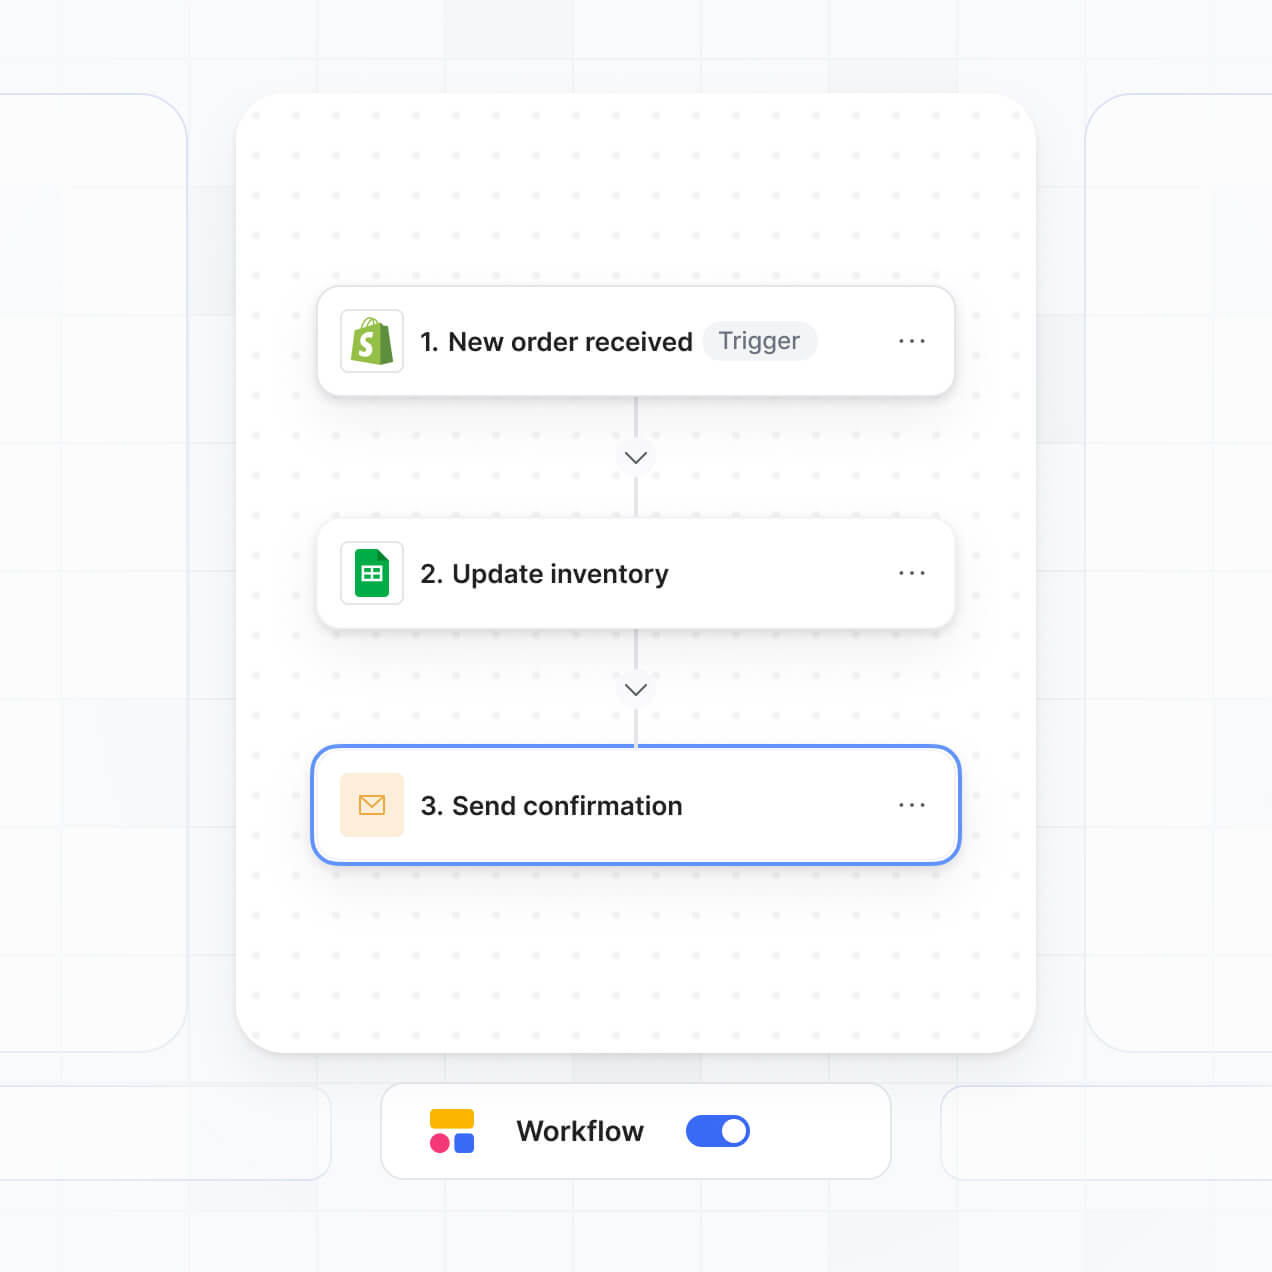
Use Softr Workflows to trigger report updates, notifications, and record changes when dashboard data changes.
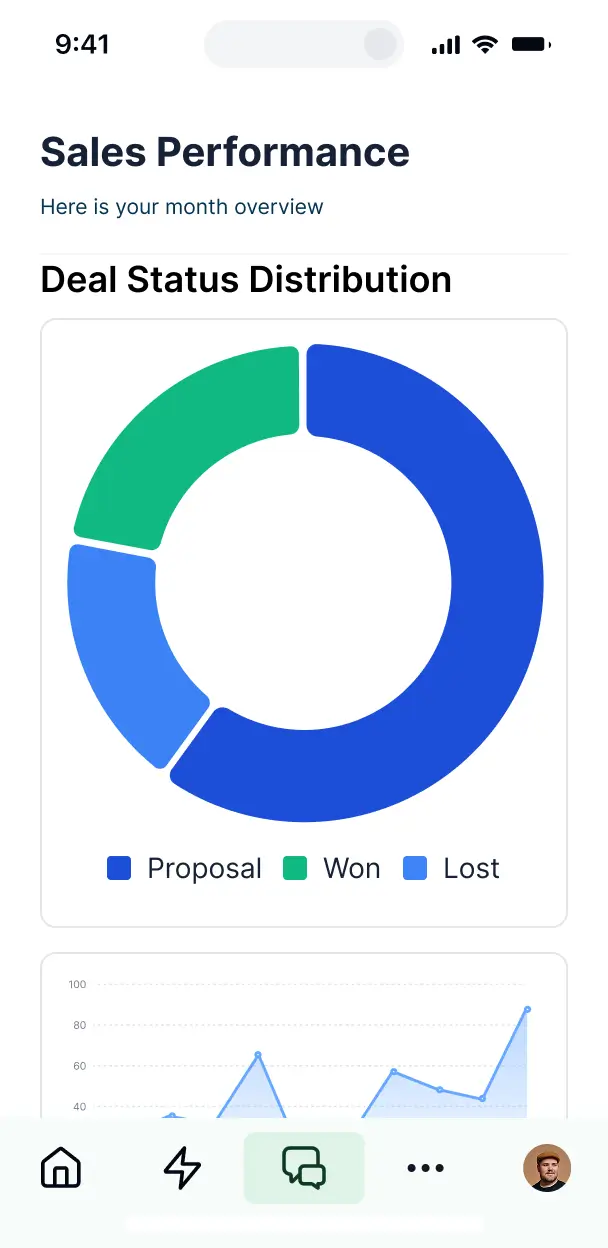
Access KPI overviews, filtered reports, and data questions on the go. All apps are mobile-ready out of the box.
Use Google, email, or SSO logins to give teams secure access to dashboards and reporting data.
Keep reporting data protected with SOC 2 Type II compliance, encryption, and fine-tuned access control.
No more one-size-fits-all tools or costly custom builds. Softr is easy to use and fully customizable, so you can launch faster, adapt as you grow, and skip the complexity of traditional software.

Describe your KPIs and reporting needs, then generate a working dashboard in minutes.

Add reporting views, data questions, and automated updates as your dashboard needs change.

Bring KPI tracking, filtered reports, and record classification into one dashboard.
Co-build with AI
Simply describe what you need. Let Softr handle everything - Interface, database, workflows.
Iterate with AI or visually
Control most critical parts of your app yourself - roles, permissions, security.
Ship the same day
Invite team members or external clients and partners right away. No developer handover.
Use drag-and-drop blocks to build a portal that looks sleek and modern out of the box. Add only the features you need, and iterate as your workflows evolve.




A dashboard is a secure workspace where managers, analysts, and operations teams log in to monitor the metrics they need. It can bring together sales figures, project status, support volume, inventory levels, and performance timelines in one place. Instead of piecing together email updates and spreadsheets, teams get a shared view of current business activity.
The main benefit for reporting teams is getting reliable operational visibility without waiting for a developer. Softr is an AI app builder for business software: describe the metrics, filters, and user roles you need, and it generates the database, pages, and logic, already connected and secure, with no code at any point. You can also start from a reporting template or build from scratch. Use Softr Databases, or connect tools such as Airtable, Google Sheets, or HubSpot. You still control the layout, who sees revenue or project records, and how the dashboard reflects your brand. Every part remains editable in the visual builder.
A reporting dashboard can include features such as:
- **AI inside the app:** Ask AI can answer questions about revenue by region or overdue projects, while Database AI Agents can classify support tickets or flag unusual KPI values.
- **Custom components:** A Vibe Coding block can create a bespoke KPI scorecard with comparison indicators when standard blocks do not fit.
- **Automations:** Softr Workflows can refresh a reporting status or notify a department lead when a target record changes or someone clicks an approval button.
- **Access controls:** Give executives a company-wide view while restricting team leads to their own accounts, projects, or regions.
- **Input and reporting tools:** Build forms with file uploads and conditional logic, then display live data in charts, filtered lists, tables, kanban boards, or detail views.
Everything uses drag-and-drop blocks and can be edited later.
Start by describing the reporting problem in plain language, such as a dashboard that shows pipeline value, renewal risk, and project delivery by team. Softr generates the app on a production-ready foundation, including authentication, database logic, and security. That avoids the Day Two problem common with raw generated code, where a broken filter can expose the wrong KPI view or make monthly reporting hard to maintain. If you use a Vibe Coding block for a custom chart or scorecard, every prompt and edit is versioned, so you can roll back a change instead of trying to re-prompt your way out of it.
Yes. One dashboard can serve sales, finance, operations, and customer success while each person sees only the records assigned to their role. A sales manager can view pipeline and forecast data, while an operations lead sees delivery status and inventory figures rather than another department's reports.
A spreadsheet is not required to get started. Softr Databases is built into the platform, so you can create tables for KPIs, sales results, project milestones, and reporting periods before importing existing rows. If your figures already live elsewhere, connect Airtable, Google Sheets, HubSpot, Notion, Coda, monday.com, Supabase, or SQL, with availability depending on the source and plan. The REST API connector covers other systems. Either way, you decide how records are structured, filtered, and displayed.
Softr Databases is the recommended starting point for a dashboard because it is a native relational source built for business apps. Native data provides high performance, instant automation triggers, and fast access without an external API in the way. Softr also connects to 21+ external sources, including Airtable, Google Sheets, HubSpot, SmartSuite, and BigQuery, with some sources available on higher plans. One dashboard can draw on several sources at once, and most external connections support real-time two-way sync. That lets a finance report combine budget records with sales results or support data while preserving the source systems your teams already use.
Permissions can reflect the reporting structure behind the dashboard. For example, a regional manager may view revenue, forecast, and customer records for their territory, while an executive can see company-wide figures and department comparisons. You control navigation, page visibility, block visibility, and precise view or edit rights. Views can also filter records by the logged-in user. Before launch, the built-in preview lets you open the dashboard as each user group, so you can check who sees which KPI and account records without creating test accounts.
Your dashboard can use your logo, brand colors, fonts, and custom domain, with Softr branding removed. That gives executives, department leads, and client stakeholders a reporting experience that matches the organization they already work with.
Reporting pages can be arranged around the questions each audience asks. Adjust colors, fonts, spacing, and page structure, then choose which blocks appear when a user logs in.
- A **Table** can show account-level revenue or project milestones.
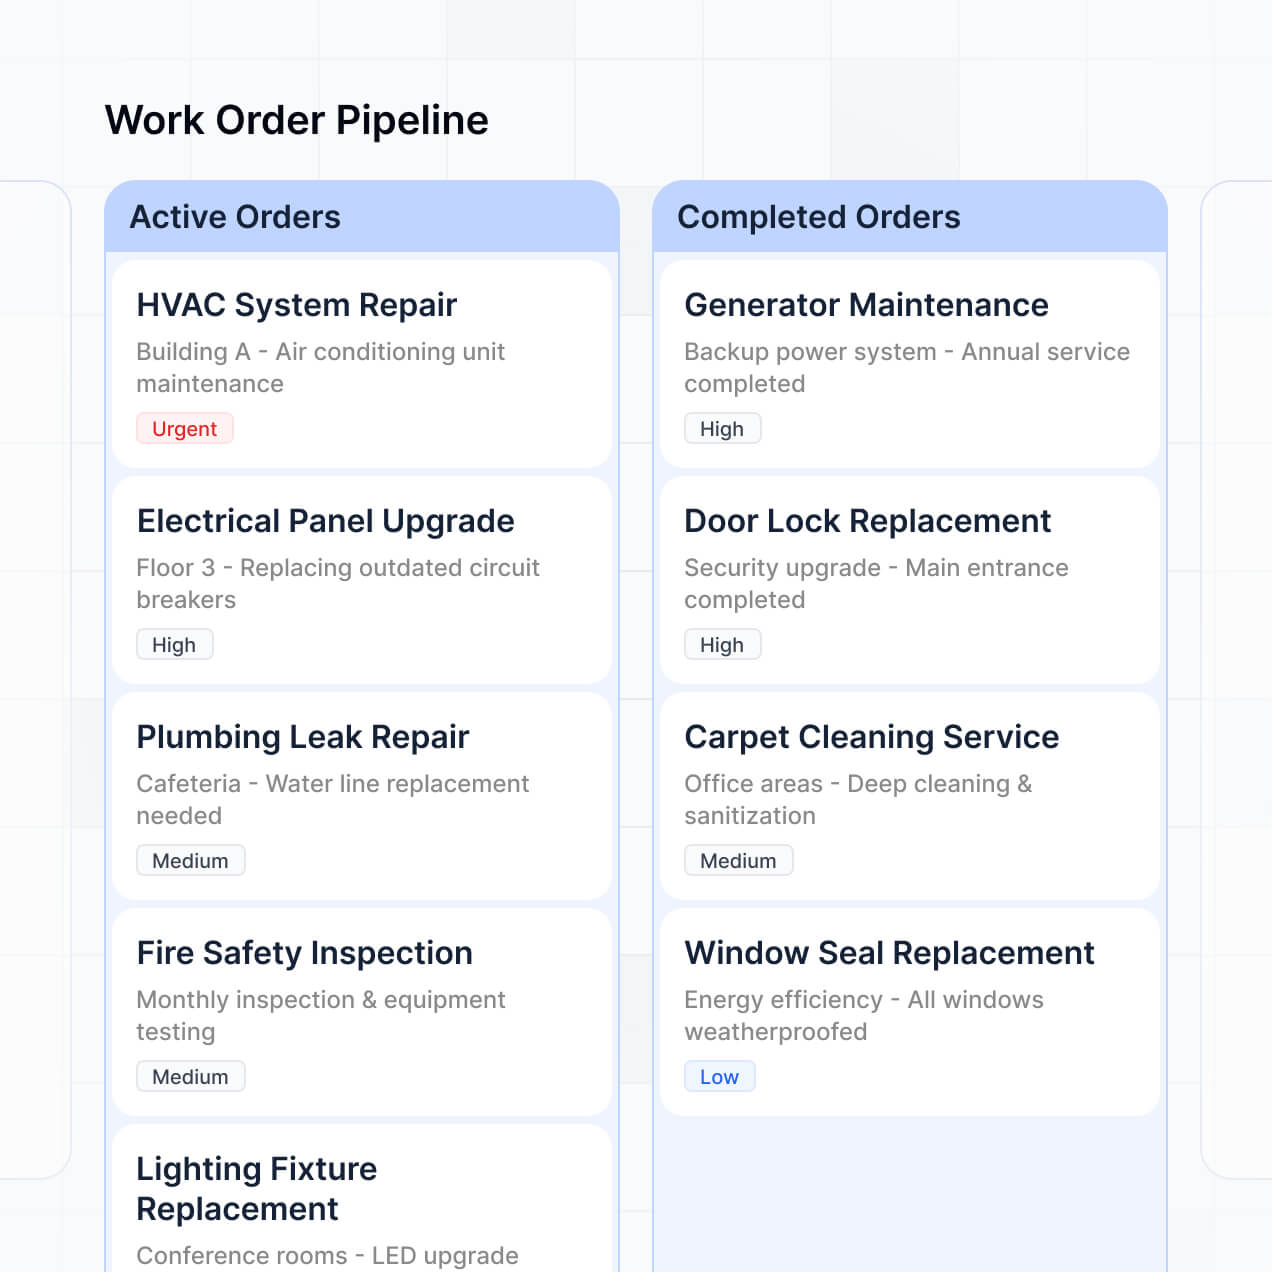
- A **List** or **Card** block can summarize open deals, incidents, or priority tasks.
- A **Detail View** can reveal the full record behind a KPI.
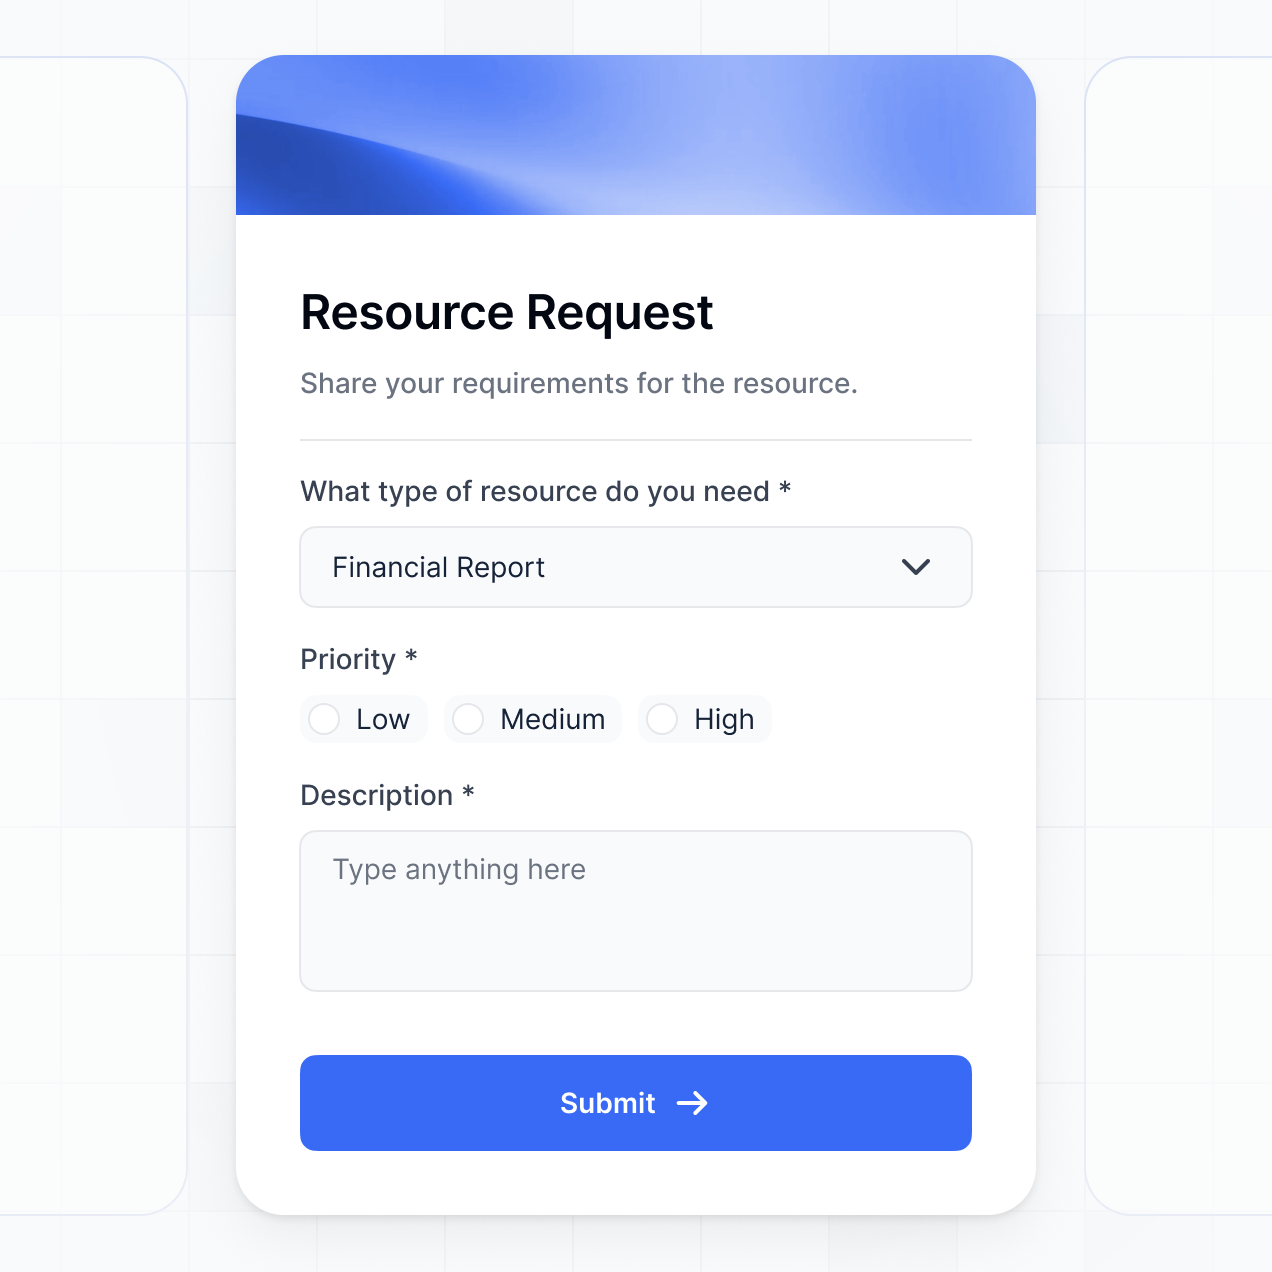
- **Forms** can collect forecast updates or monthly commentary.
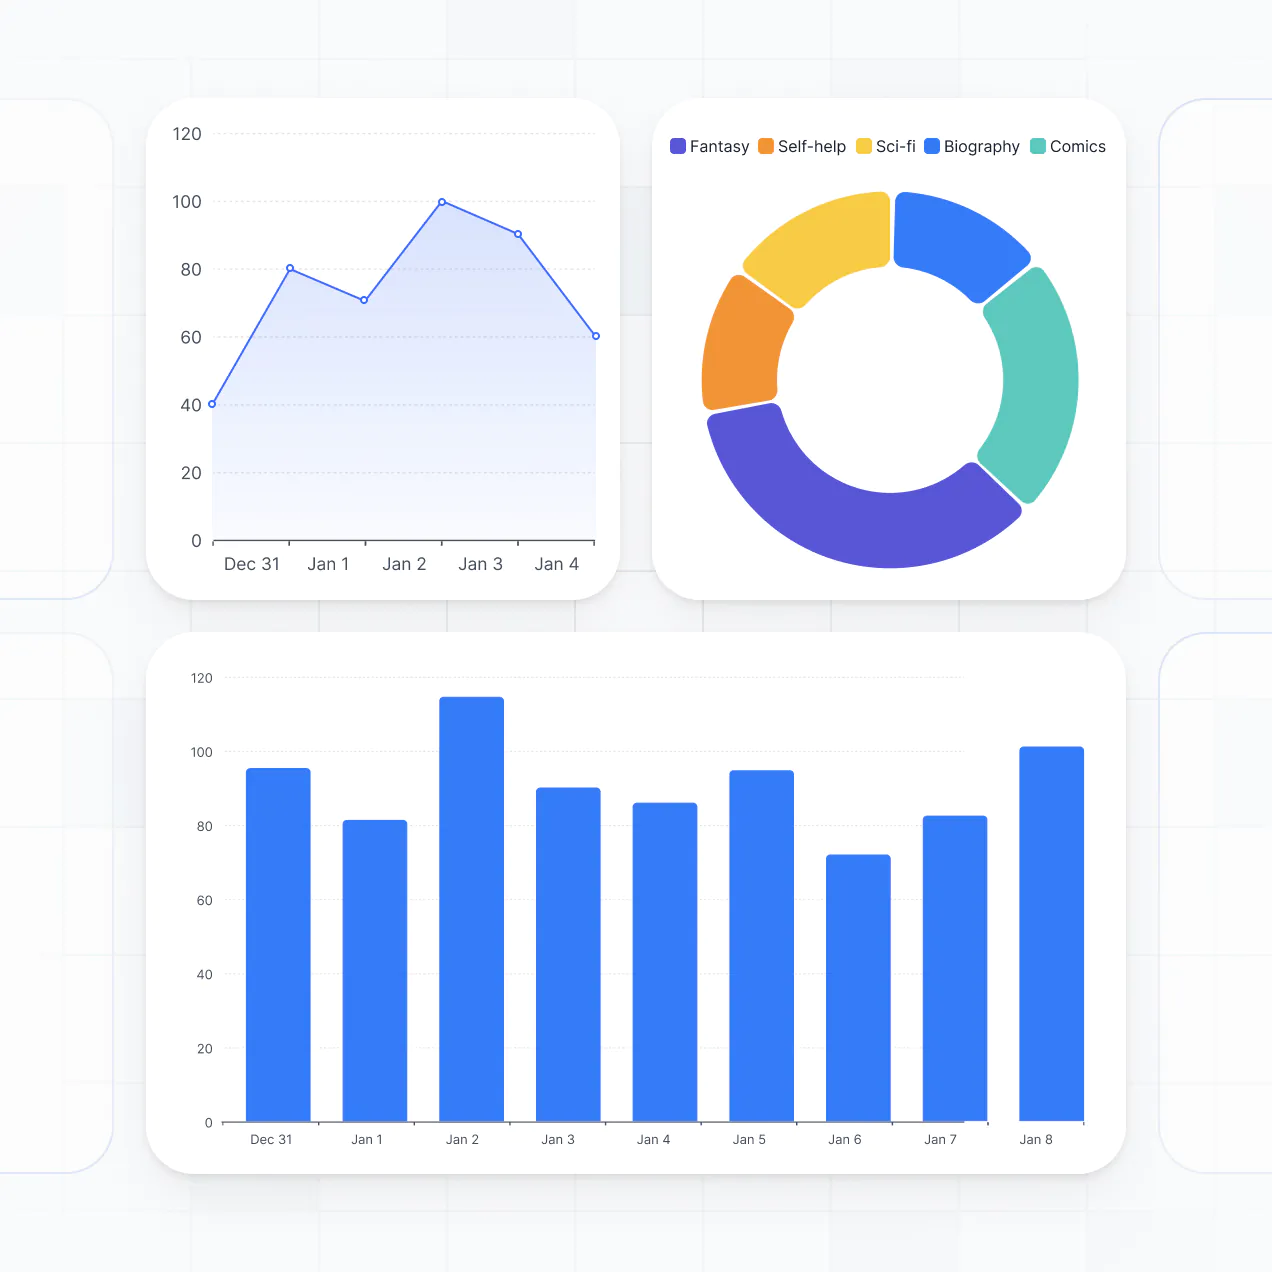
- **Charts** can compare sales targets, ticket volume, or budget variance.
- A **Calendar** can show launches, reviews, or reporting deadlines.
The visual builder keeps every block editable, so analysts can refine the layout as reporting needs change.
A dashboard may contain sensitive records such as revenue forecasts, customer accounts, or employee performance figures, so access needs to be controlled at more than the page level. Softr encrypts data in transit with TLS and at rest on secure infrastructure. Role-based permissions, users managed in your data source, visibility rules, and global restrictions help determine which manager can view or edit each report. With Softr Databases, data remains in Softr's secure environment, hosted in Europe, Germany, and the database is SOC 2 Type II compliant. With external sources, Softr stores nothing and displays live data according to your access settings. Authentication, access control, and monitoring follow industry best practices.
Production means department leads can use the dashboard for real KPI reviews, forecasts, and operational decisions without rebuilding it after the first launch. Softr is production-ready because it builds on a stable business-grade foundation rather than leaving you with fragile custom code. Authentication, secure hosting, and granular permissions are handled natively, reducing the Day Two problems that can make a reporting app difficult to maintain or secure. The same foundation supports more than 1 million builders, so the app can move from an initial sales report to a working system for real users and records.
Pure vibe coding tools generate raw code that can be fragile, while traditional no-code tools often require hours of manual configuration for authentication, roles, and data logic. Softr takes a hybrid approach: describe a dashboard in plain language, generate the database, pages, and logic in minutes, then refine charts, filters, and permissions visually. Business-grade hosting and access controls are already in place, which helps non-technical teams move from a reporting prototype to production. Softr apps are also agent-ready through MCP. A logged-in user can operate the dashboard through an AI assistant, but only within the same interface permissions, user groups, and data restrictions. There is no second permission model to build or audit.
A useful first automation is notifying a finance lead when a monthly forecast record changes, or sending an operations alert when an inventory threshold is reached. Softr Workflows handles tasks inside the dashboard when a record changes or a button is clicked. The app can also sync with tools such as Stripe and Intercom, while REST API connections and webhooks cover advanced cases. That supports sending report data to another system, triggering an automation from a user action, or displaying customer, payment, and support records in one reporting view, without code.
Describe your metrics and reporting views, then launch a dashboard your team can use today. No code needed.