Create KPI dashboards from reporting data in minutes, with filters, permissions, and views that hold up for stakeholder reporting.
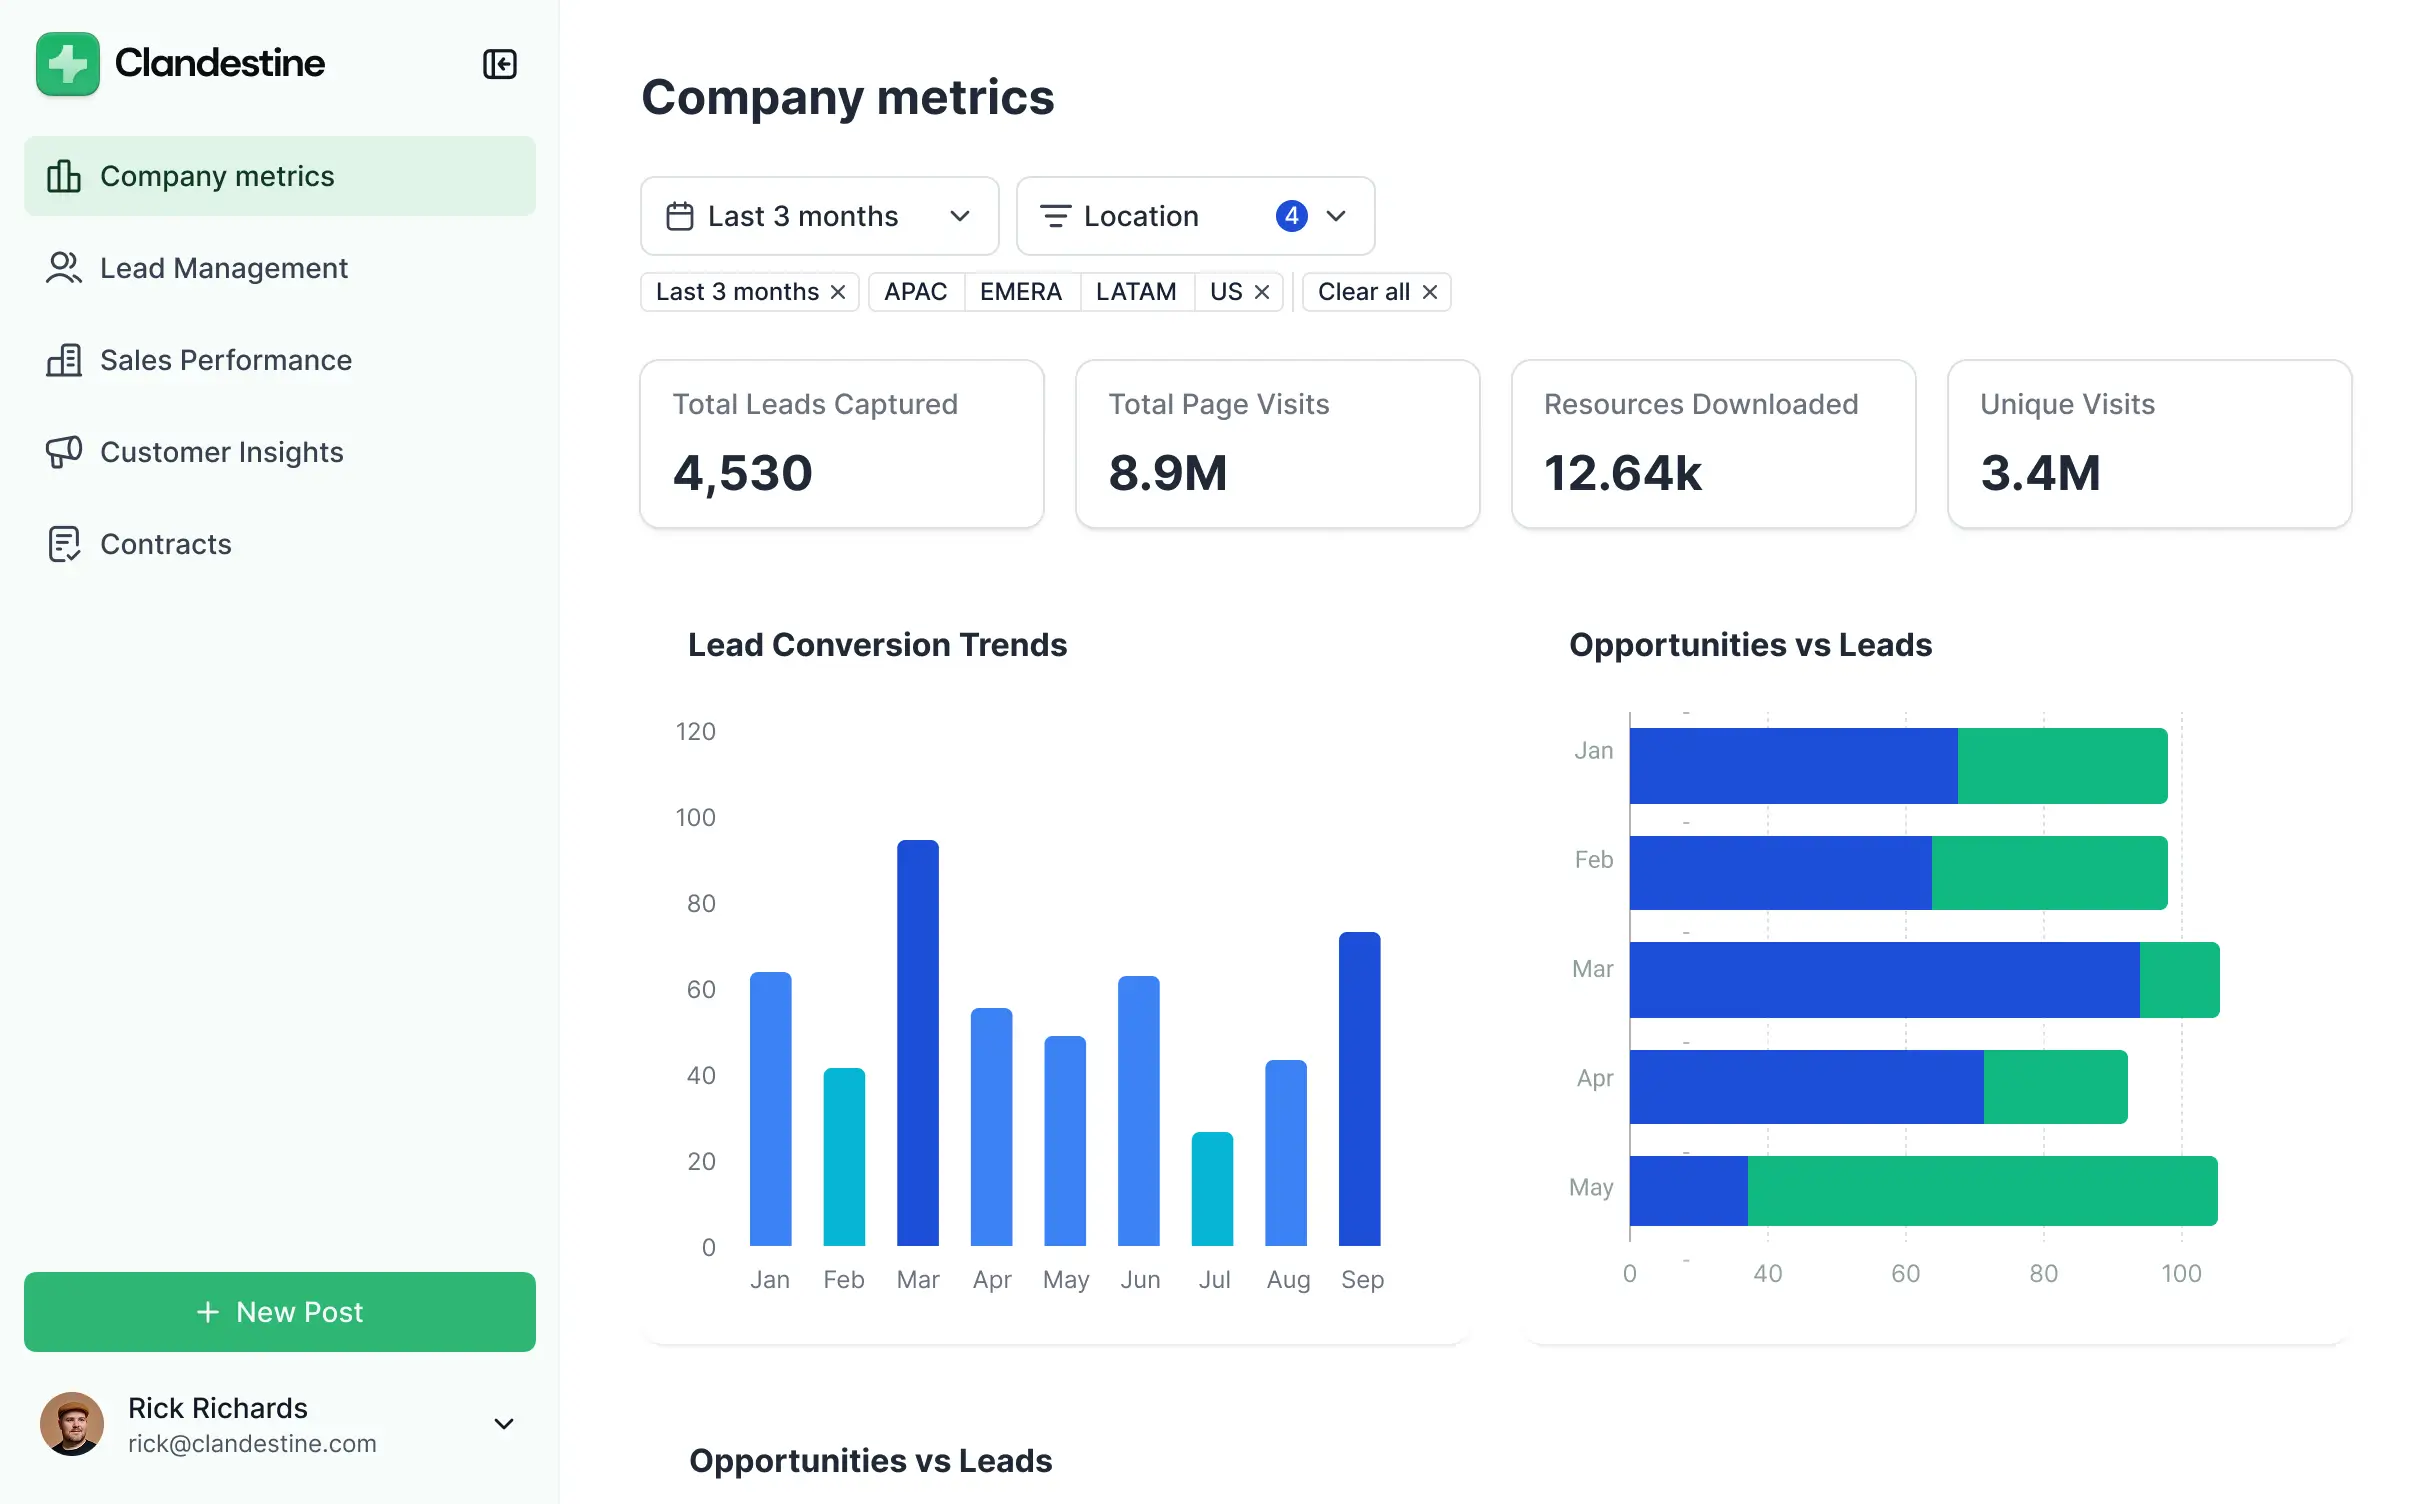
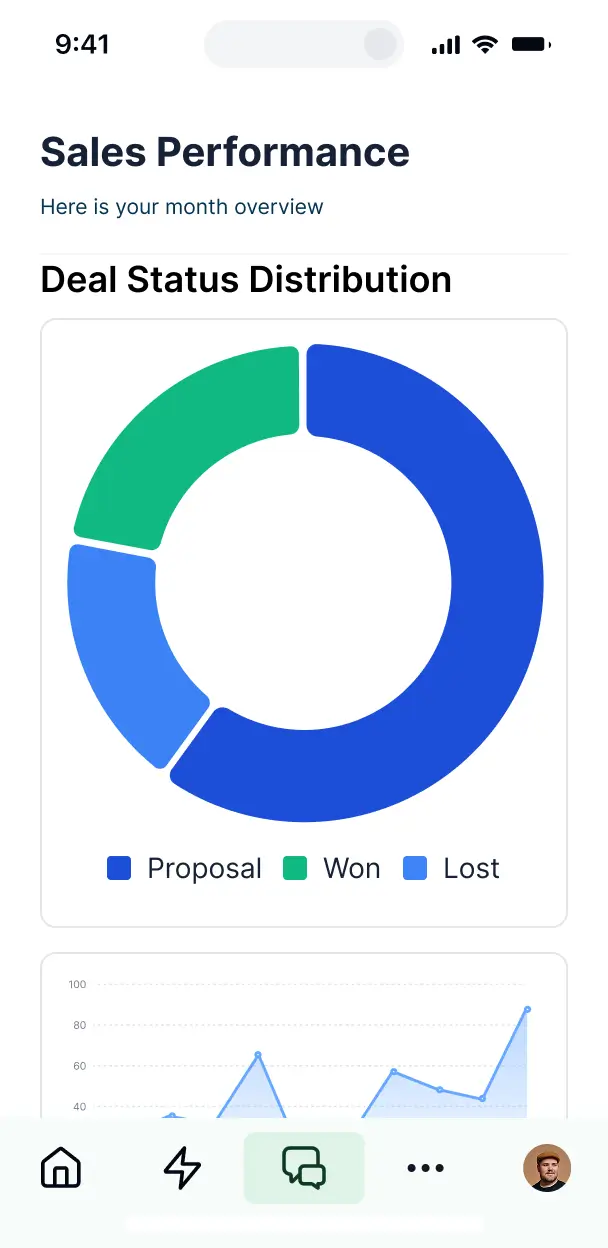

Choose only the views and workflows your reports require, then adapt your dashboard as metrics change, stakeholders grow, and reporting needs evolve.


Connect Airtable, Google Sheets, and other systems with real-time sync, or manage everything in Softr Databases. Create a single source of truth for your reporting data.
Give each teammate the right reporting views and access. Set up secure logins, user groups, and granular permissions, no dev work needed.
Give stakeholders and teammates tailored dashboard views, so each group sees the metrics and reports they need.
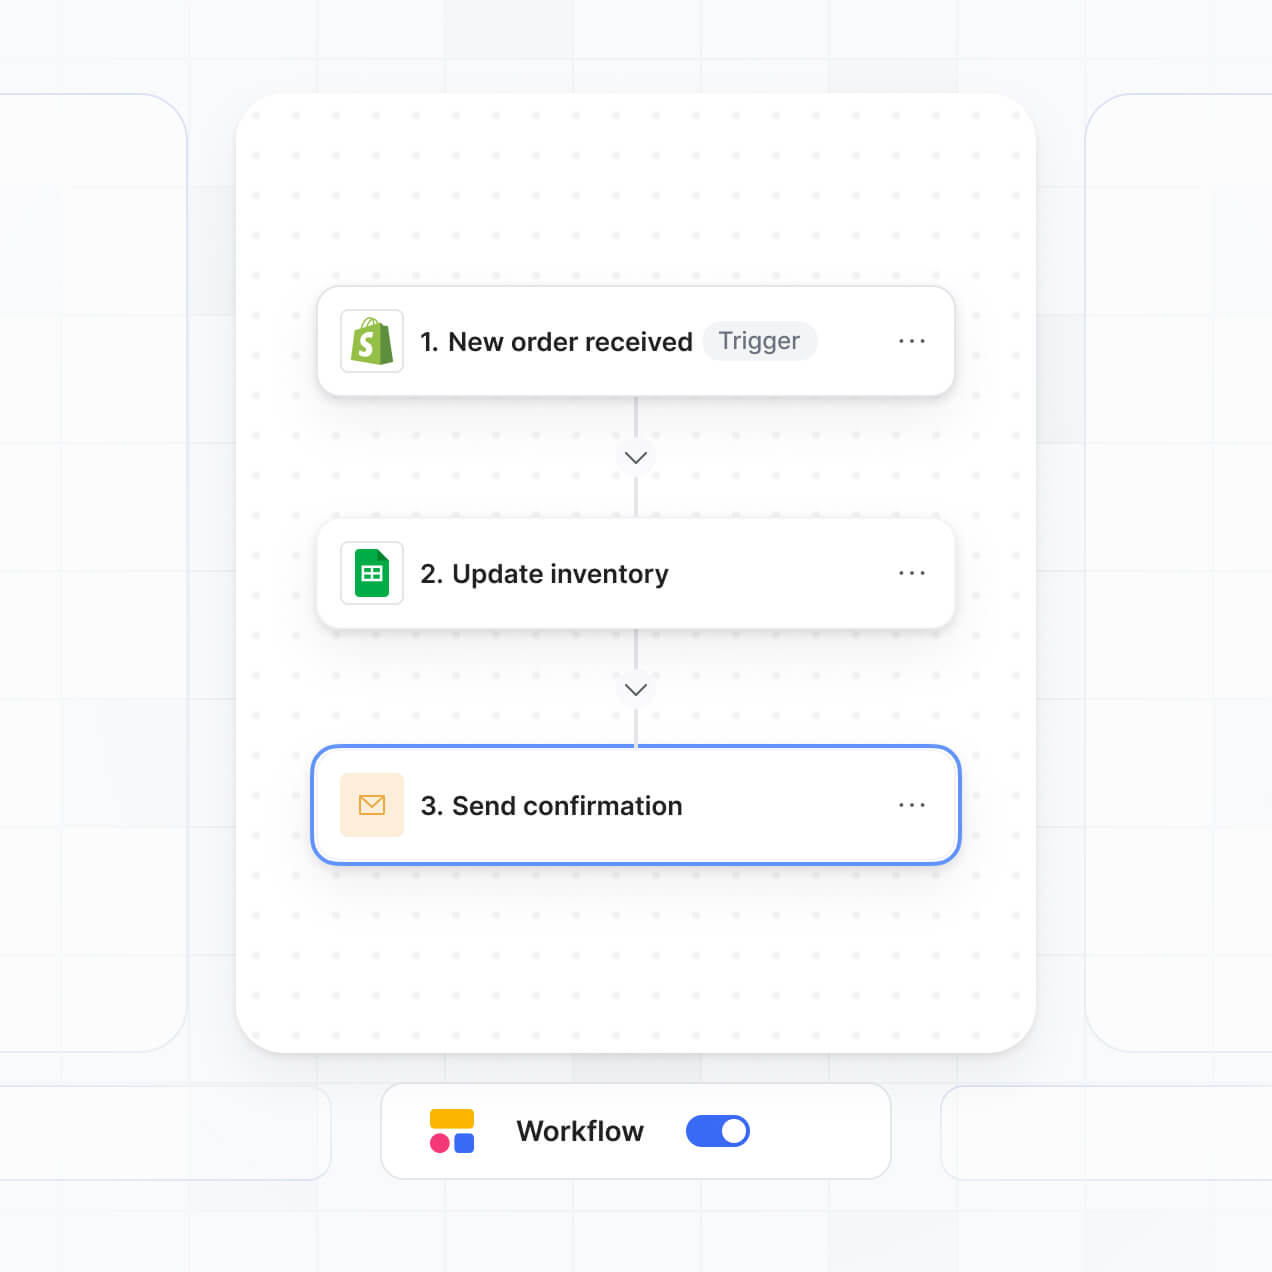
Trigger native automations when metric records change or a report action is clicked, keeping reporting workflows moving.
Review KPI dashboards and update reporting data on the go. All apps are mobile-ready by default.
Use Google, email, or SSO logins to give dashboard users secure access to the reports assigned to them.
Keep reporting data protected with SOC 2 compliance, encrypted connections, and granular access controls.
No more one-size-fits-all tools or costly custom builds. Softr is easy to use and fully customizable, so you can launch faster, adapt as you grow, and skip the complexity of traditional software.

Describe the KPI views and reports you need, then get a working dashboard in minutes.

Add filters, stakeholder views, and workflows as reporting requirements change, without starting over.

Bring reporting data, KPI views, stakeholder reports, and data questions into one place.
Co-build with AI
Simply describe what you need. Let Softr handle everything - Interface, database, workflows.
Iterate with AI or visually
Control most critical parts of your app yourself - roles, permissions, security.
Ship the same day
Invite team members or external clients and partners right away. No developer handover.
Use drag-and-drop blocks to build a portal that looks sleek and modern out of the box. Add only the features you need, and iterate as your workflows evolve.




A dashboard is a secure workspace where managers and teams log in to monitor the metrics that guide daily decisions. It can bring together KPI cards, revenue figures, sales pipeline stages, support tickets, project milestones, and operational updates in one place. Instead of searching through email threads and spreadsheets, finance, sales, and operations teams get a shared view of current performance, trends, and outstanding work.
For operations and leadership teams, the main benefit is turning scattered performance data into a working decision tool without waiting for a developer. Softr is an AI app builder for business software. Describe the KPIs, sales records, and reporting views you need, and AI generates the database, pages, and logic, already connected and secure, with no code at any point. You can also start from a template or build from scratch, then refine everything visually. Data can run on Softr Databases or connected tools such as Airtable, Google Sheets, or HubSpot. You control the layout, which teams see each report, and how the dashboard reflects your brand.
A dashboard can combine reporting, action, and controlled access in one app. You can add:
- **AI inside the app:** Ask AI can answer questions about revenue, pipeline, or ticket volumes, while Database AI Agents can classify support tickets or flag sales records that need attention.
- **Custom interface:** A Vibe Coding block could create a KPI scorecard, variance indicator, or department health widget that standard blocks do not cover.
- **Automations:** Softr Workflows can send a follow-up when a target changes or create a review task when a button is clicked.
- **Access controls:** Logins and permissions ensure executives, regional managers, and analysts see the records assigned to them.
- **Reporting blocks:** Use forms with file uploads and conditional logic, plus dashboards and charts on live data. Tables, lists, kanban boards, detail views, and filters keep campaign records, project milestones, and customer accounts easy to explore. Everything is drag-and-drop and remains editable later.
Vibe coding means describing what you want and letting AI build it. Tell Softr to create a dashboard for regional managers with revenue KPIs, pipeline stages, and overdue support tickets, including the rules for who can view each region. Softr produces the app on a stable, secure foundation, handling authentication, database logic, and security natively. That differs from tools that leave you maintaining fragile generated code when a metric changes or a new team joins. If a Vibe Coding block powers a custom chart or scorecard, every prompt and edit is versioned, so a broken change can be rolled back instead of becoming a Day Two maintenance problem.
Yes. A single dashboard can serve executives, regional managers, finance teams, and sales representatives while each person sees only the KPIs, accounts, and records assigned to their role. Login-based permissions keep regional revenue and pipeline data separated, while leadership can retain a broader view across departments.
A spreadsheet is a common starting point, but you do not need one. Softr Databases is built into the platform, so you can create structured tables for KPIs, sales opportunities, budgets, and support tickets before adding dashboard pages. If your records already live elsewhere, you can connect Airtable, Google Sheets, HubSpot, Notion, Coda, monday.com, Supabase, or SQL, and the REST API connector covers other sources. Either way, you decide how metrics are structured, filtered, and displayed to each team.
Softr Databases is the recommended starting point for a dashboard because it is a native relational source built for business apps. Your KPI records, revenue data, and pipeline stages stay native to the platform for high performance, instant automation triggers, and fast loading. Softr also connects to 21+ external data sources, including Airtable, Google Sheets, HubSpot, SmartSuite, and BigQuery. One dashboard can draw on several sources at once, such as combining finance figures from Google Sheets with customer records from HubSpot. Most external sources support real-time two-way sync, so reports can reflect changes without creating a separate copy of the data.
You can control the dashboard layout, navigation, pages, blocks, and records each person can access. For example, a regional manager could view revenue, pipeline, and support tickets for their territory, while a finance analyst can edit budget figures but cannot change sales ownership. Views can also filter automatically by the logged-in user, so each manager lands on the relevant accounts and KPIs. Define precise view and edit rights, then use Softr's built-in preview to open the app as an executive, manager, or analyst before anything ships. You can confirm who sees what without creating test accounts.
Yes. Apply your organization's logo, brand colors, fonts, and custom domain, then remove Softr branding. This gives executives, department managers, and external reporting recipients a dashboard that matches the company identity instead of looking like a separate reporting tool.
You can adjust colors, fonts, spacing, page structure, navigation, and the content shown when each user logs in. Use the visual builder to match each block to the reporting task:
- **Table:** Let finance review budget lines, invoice totals, or regional revenue.
- **List or Card:** Surface sales opportunities, project risks, or overdue support tickets.
- **Detail View:** Give a manager the full history behind a customer account or KPI exception.
- **Forms:** Collect forecast updates, explanations for missed targets, or monthly metric submissions.
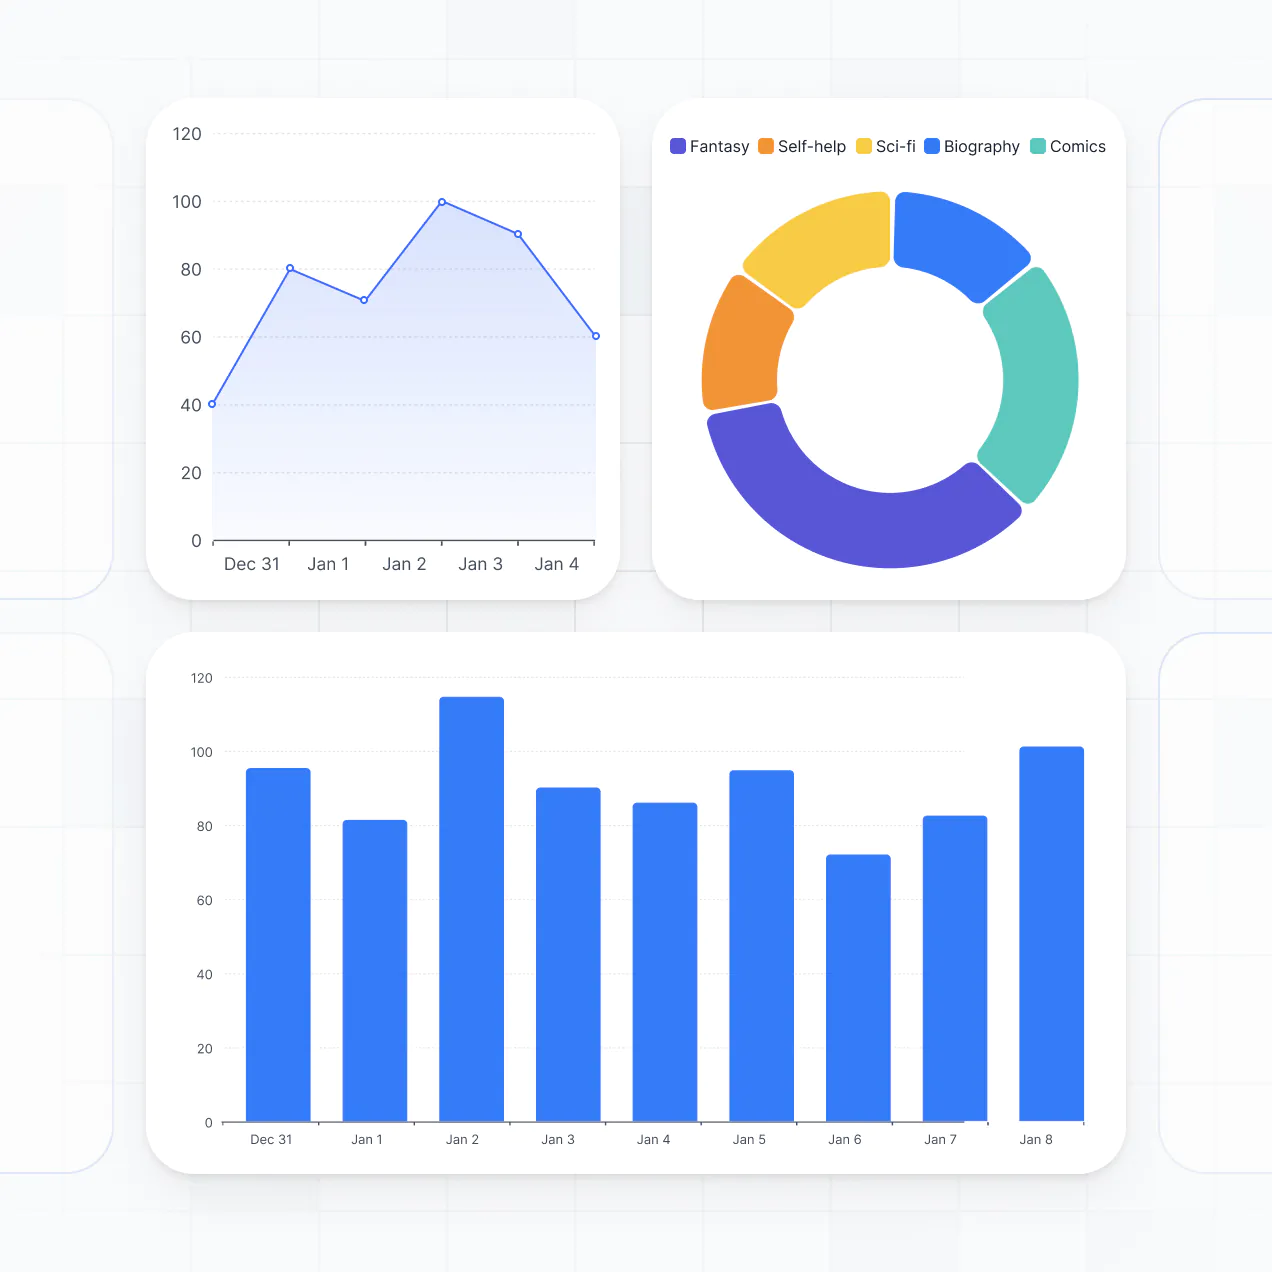
- **Charts:** Compare pipeline value, renewal rates, ticket volume, or department performance over time.
- **Calendar:** Show campaign launches, reporting deadlines, and operational reviews.
Everything stays editable later, so you can change the layout as reporting needs evolve.
Dashboard data is encrypted in transit with TLS and at rest on secure infrastructure. Role-based permissions, visibility rules, global restrictions, and users managed in your data source help protect sensitive records such as employee performance figures, customer revenue, and financial forecasts. On Softr Databases, that information sits in Softr's secure environment, hosted in Europe in Germany, and Softr Databases is SOC 2 Type II compliant. When you connect an external source, Softr stores nothing from it and displays live data according to your access settings. Authentication, access control, and monitoring follow industry best practices, so a sales manager does not automatically gain access to finance reports.
An AI-generated dashboard can be production-ready when real users depend on it for revenue reviews, staffing decisions, and support escalations. Softr builds on a stable business-grade foundation rather than leaving you with fragile custom code. Authentication, secure hosting, and granular permissions are handled natively, which reduces the Day Two problem of maintaining access rules and database logic after launch. Executives, analysts, and department managers can use the same app with the records and views assigned to them from day one.
Pure vibe coding tools generate raw code that can become difficult to secure when a KPI changes or new departments need access. Traditional no-code tools often require manual configuration before you have a usable report. Softr takes a hybrid approach: describe the dashboard, revenue metrics, and pipeline views you need, let AI generate the database, app, and logic, then refine the result with visual controls. Authentication, roles, permissions, and hosting are already part of the business-grade foundation, so non-technical teams can move from a first report to production without rebuilding the basics. Softr apps are also agent-ready through MCP. A logged-in user can operate the dashboard through an AI assistant, but only within the same groups, permissions, and data restrictions as the app itself.
You can automate the reporting tasks that slow down finance, sales, and operations teams. For example, set Softr Workflows to create a review task when a regional KPI falls below target, or trigger a notification when a forecast record changes. Softr also syncs with tools such as Stripe and Intercom, while REST API connections and webhooks cover advanced cases. These options let you send dashboard data out, trigger an automation from a button click or user action, or display customer and payment records from another system. No code is needed for the native workflow.
Connect reporting data and publish KPI views in minutes, with no dev work required.