
[.blog-callout]
TL;DR
- You can import Google Analytics data into Airtable in four ways: Data Fetcher (free, manual or scheduled), Zapier (beginner-friendly automation), Make (more customizable automation), and Parabola (visual pipelines).
- Getting the data into Airtable is only half the job. Raw rows in a grid do not help anyone make decisions.
- The real win is turning that analytics data into a live dashboard your team can actually read. With Softr, you can build a no-code analytics dashboard on top of Airtable (or any of 21+ data sources) in an afternoon.
- Softr connects to your data, adds charts and KPI cards, controls who sees what, and lets you automate refreshes with native Softr Workflows. [.blog-callout]
Airtable is a useful tool for managing and analyzing your company's data in real time, which is why so many teams use it as the backbone for marketing reporting. Pulling your Google Analytics data into Airtable can feel complicated, though, especially if you do not know where to start. This step-by-step guide walks through the most reliable ways to import Google Analytics data into Airtable, and then shows how to turn those numbers into a dashboard your whole team can use.
If you want to skip straight to the reporting layer, you can grab the SaaS Dashboard template and connect it to your data.
Import Google Analytics data to Airtable with Data Fetcher
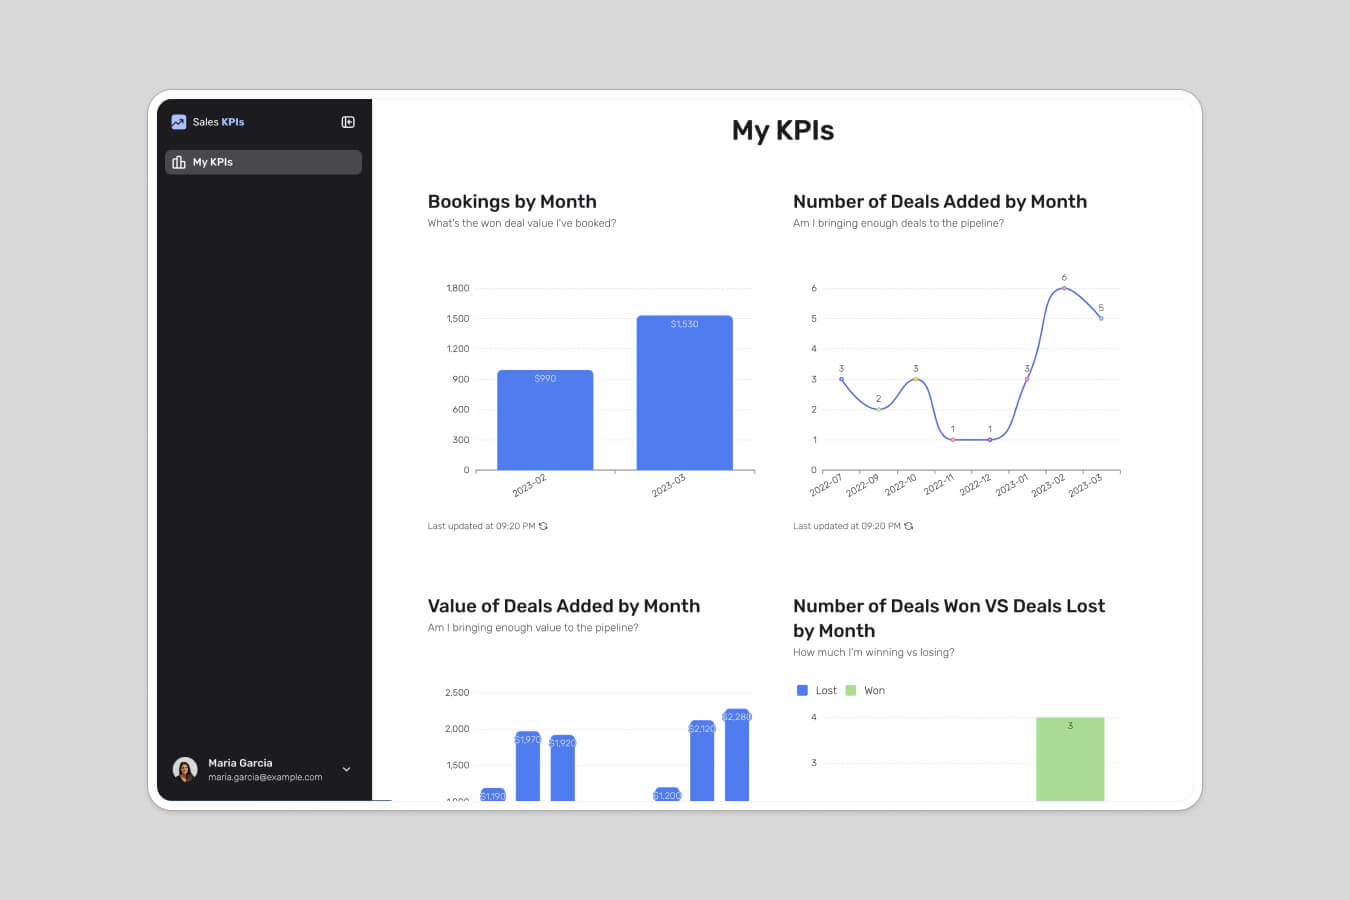
Data Fetcher is one of the best Airtable apps out there, and it can sync Airtable with a number of platforms including Google Analytics. Before you start, here is where this is all heading: once your analytics data sits in Airtable, you can connect it to Softr and present it as a clean dashboard with charts and KPI cards instead of raw rows.
To import Google Analytics data to Airtable with Data Fetcher, follow these steps:
Step 1: Install the Data fetcher app from Apps in the upper right corner of your table.
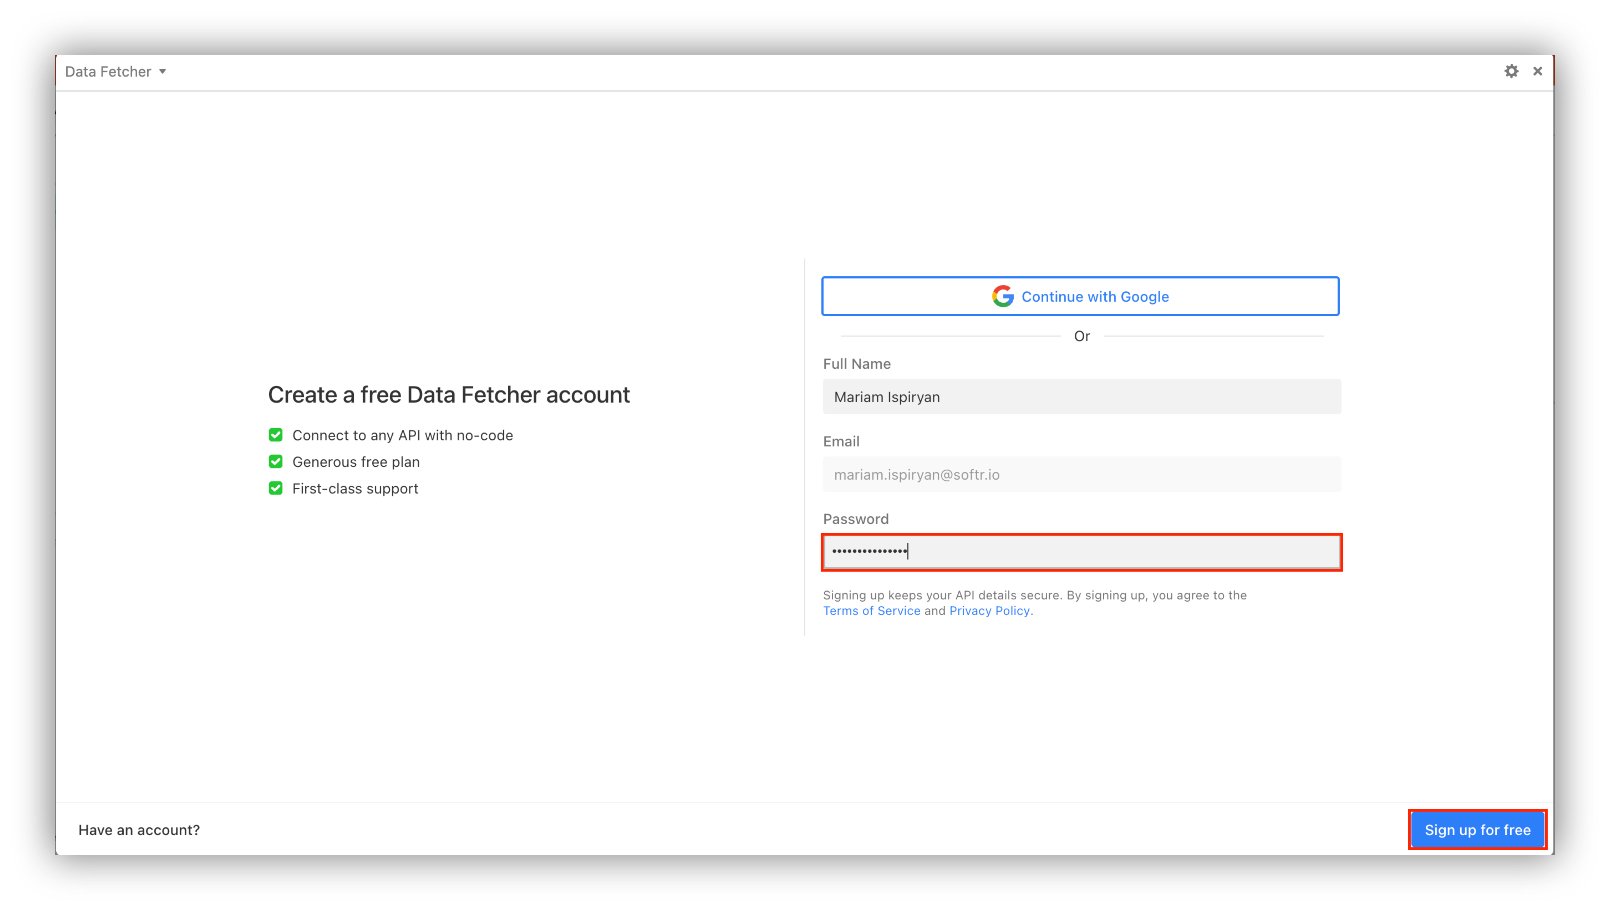
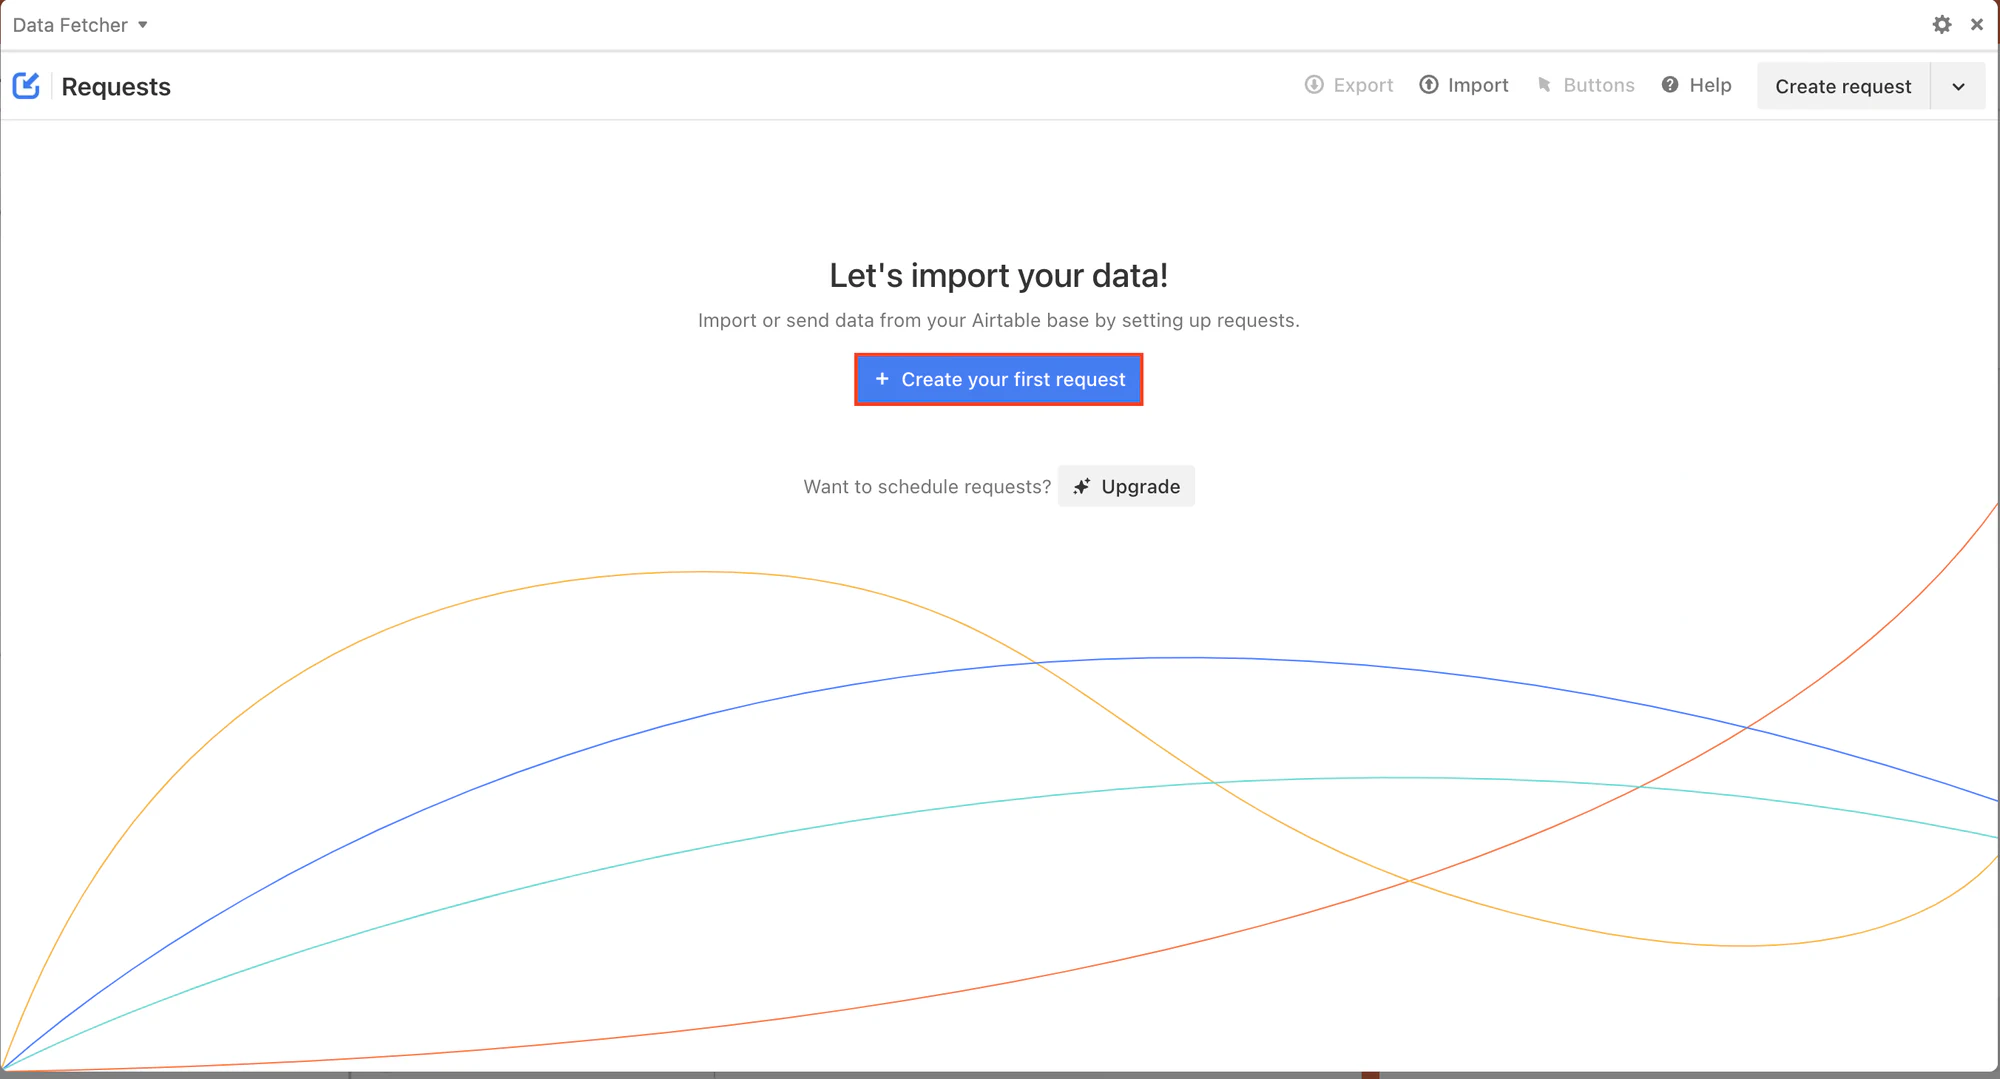
Step 2: Create a free account and create a new request
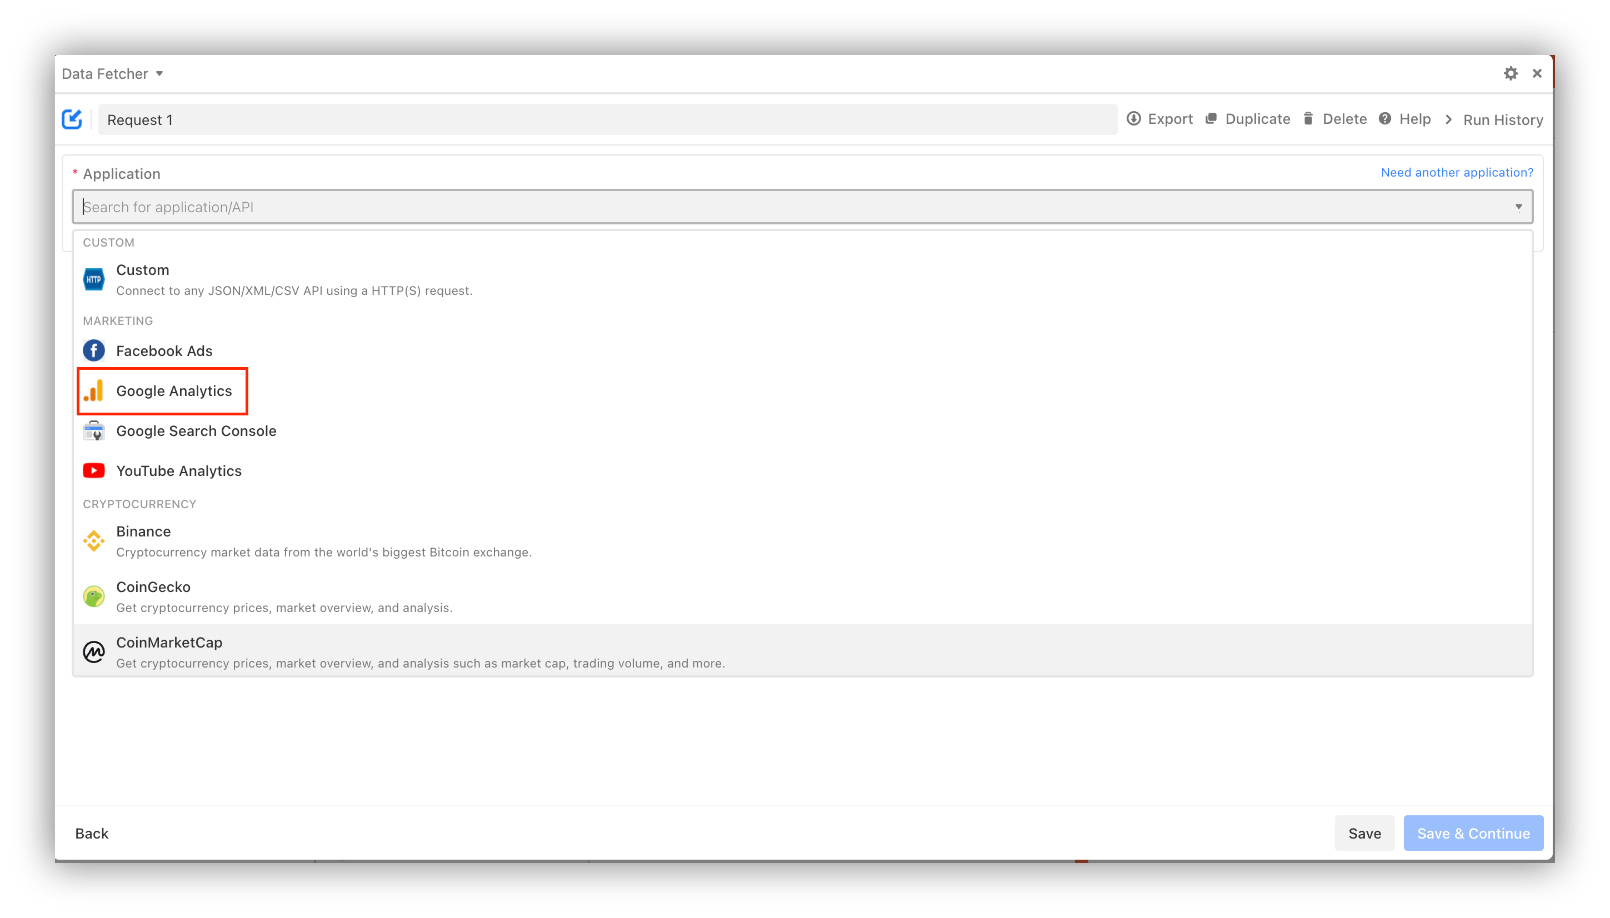
Step 3: From the Marketing section, select Google Analytics.
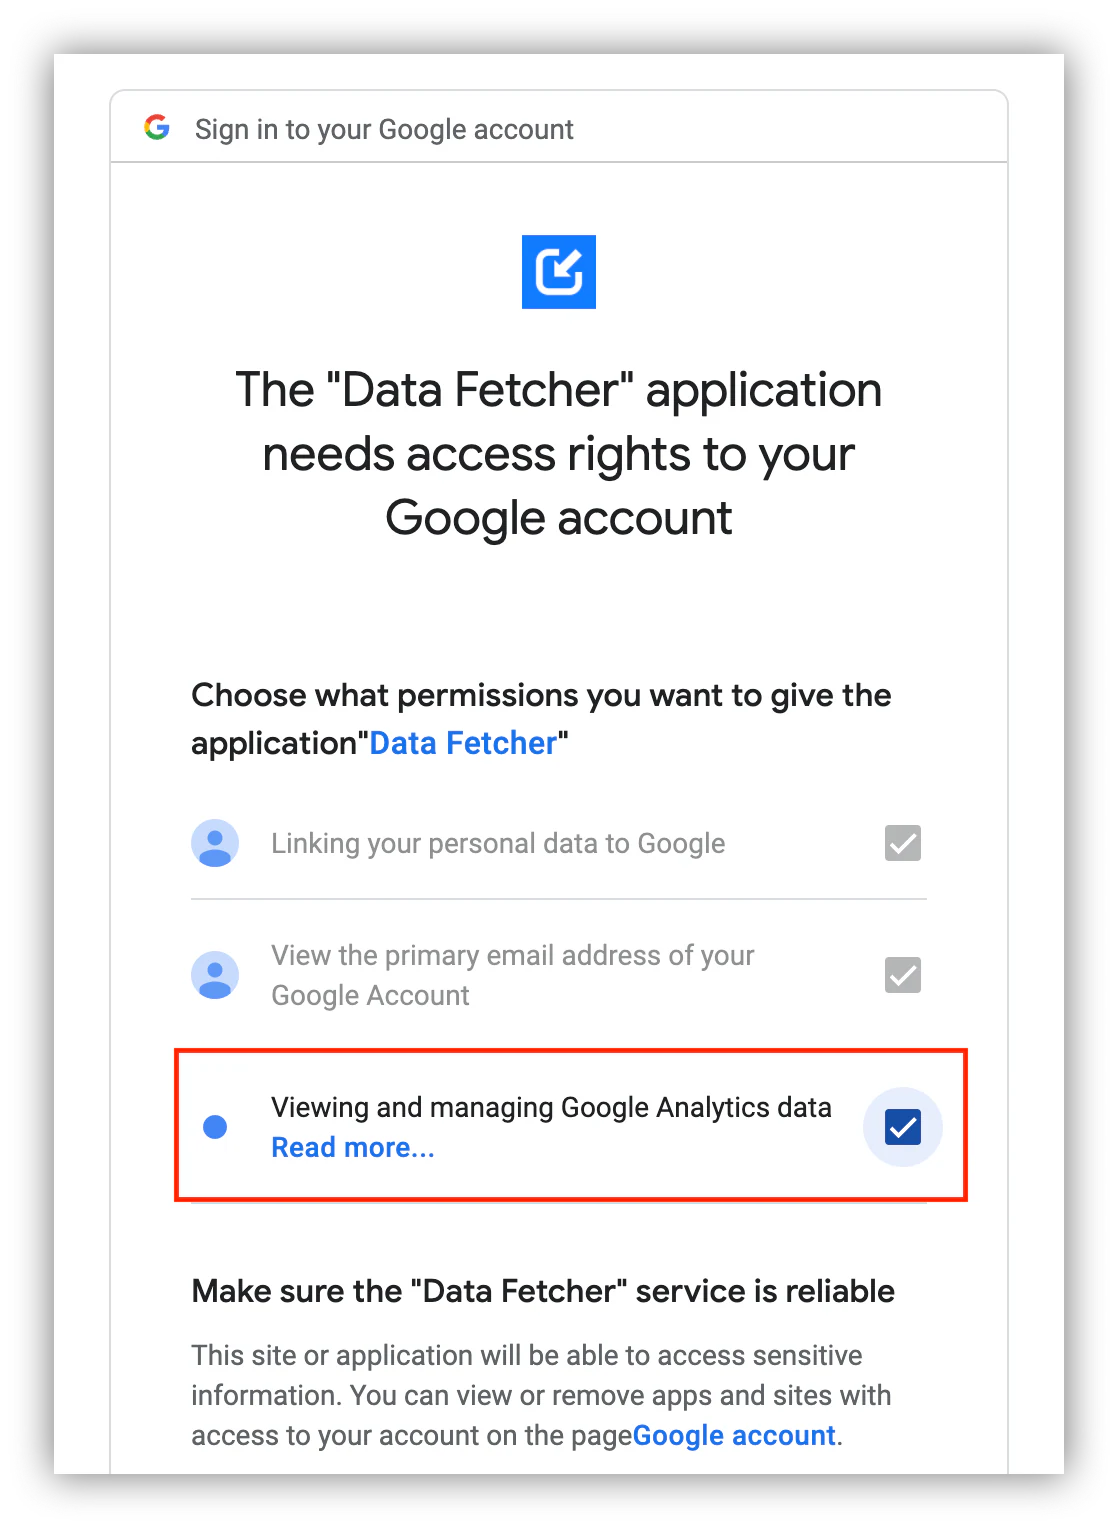
Step 4: A new tab will open where you need to authorize Data Fetcher to access your Google Analytics data.
Step 5: Choose the Google account you want to import Google Analytics data from.
Step 6: Make sure you check the ”View and manage your Google Analytics data” checkbox before proceeding.
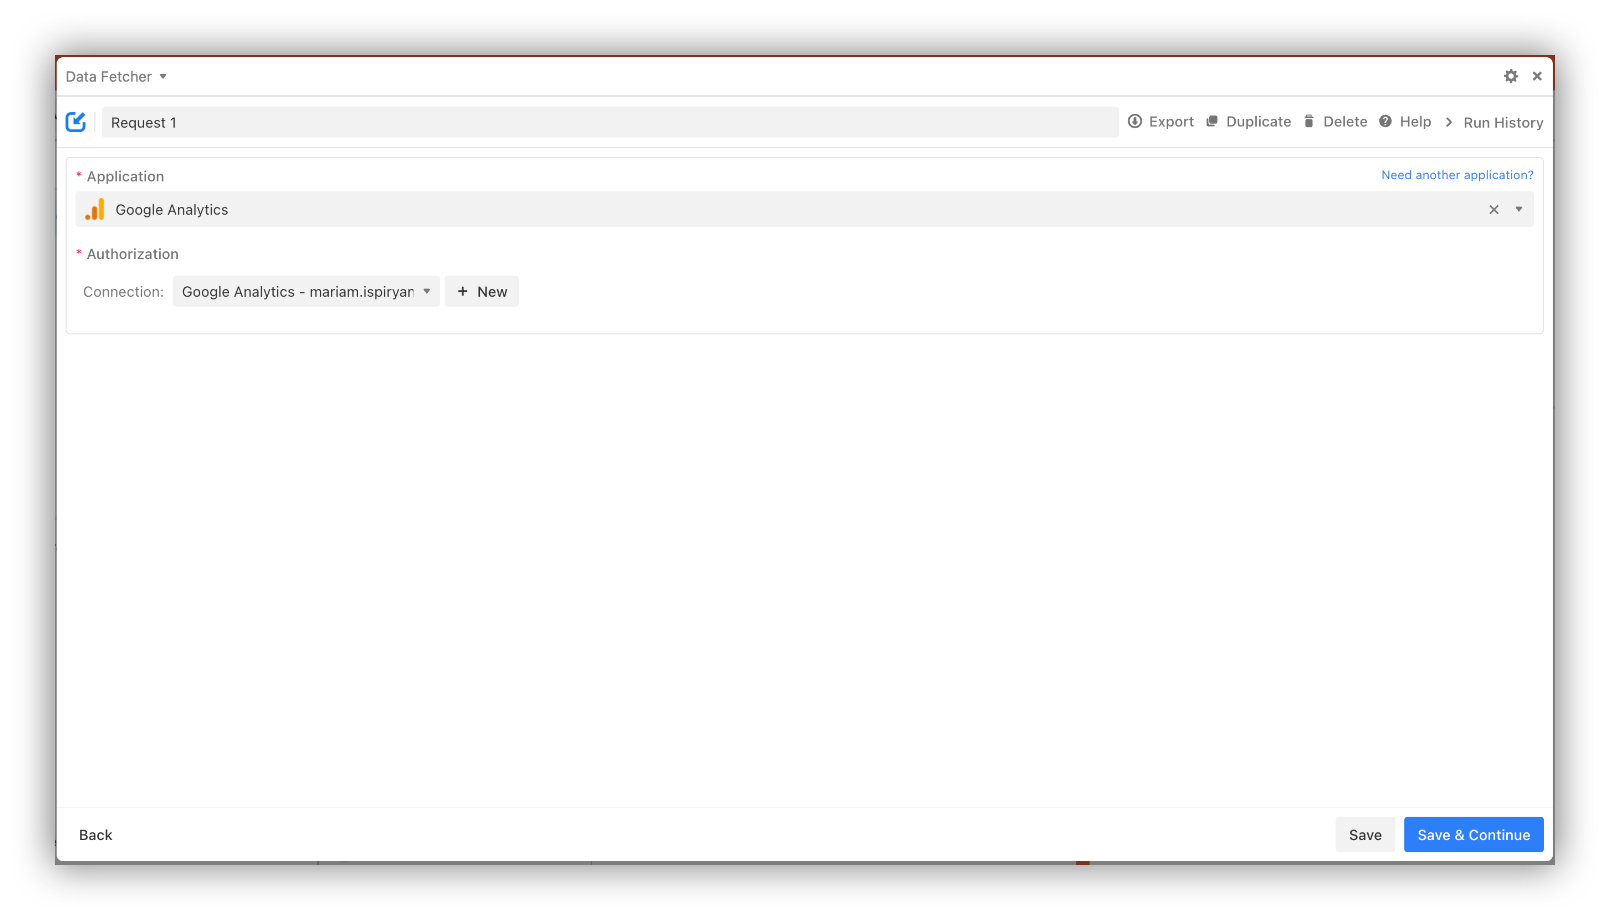
You will be back on your request page with the Google Analytics connection on.
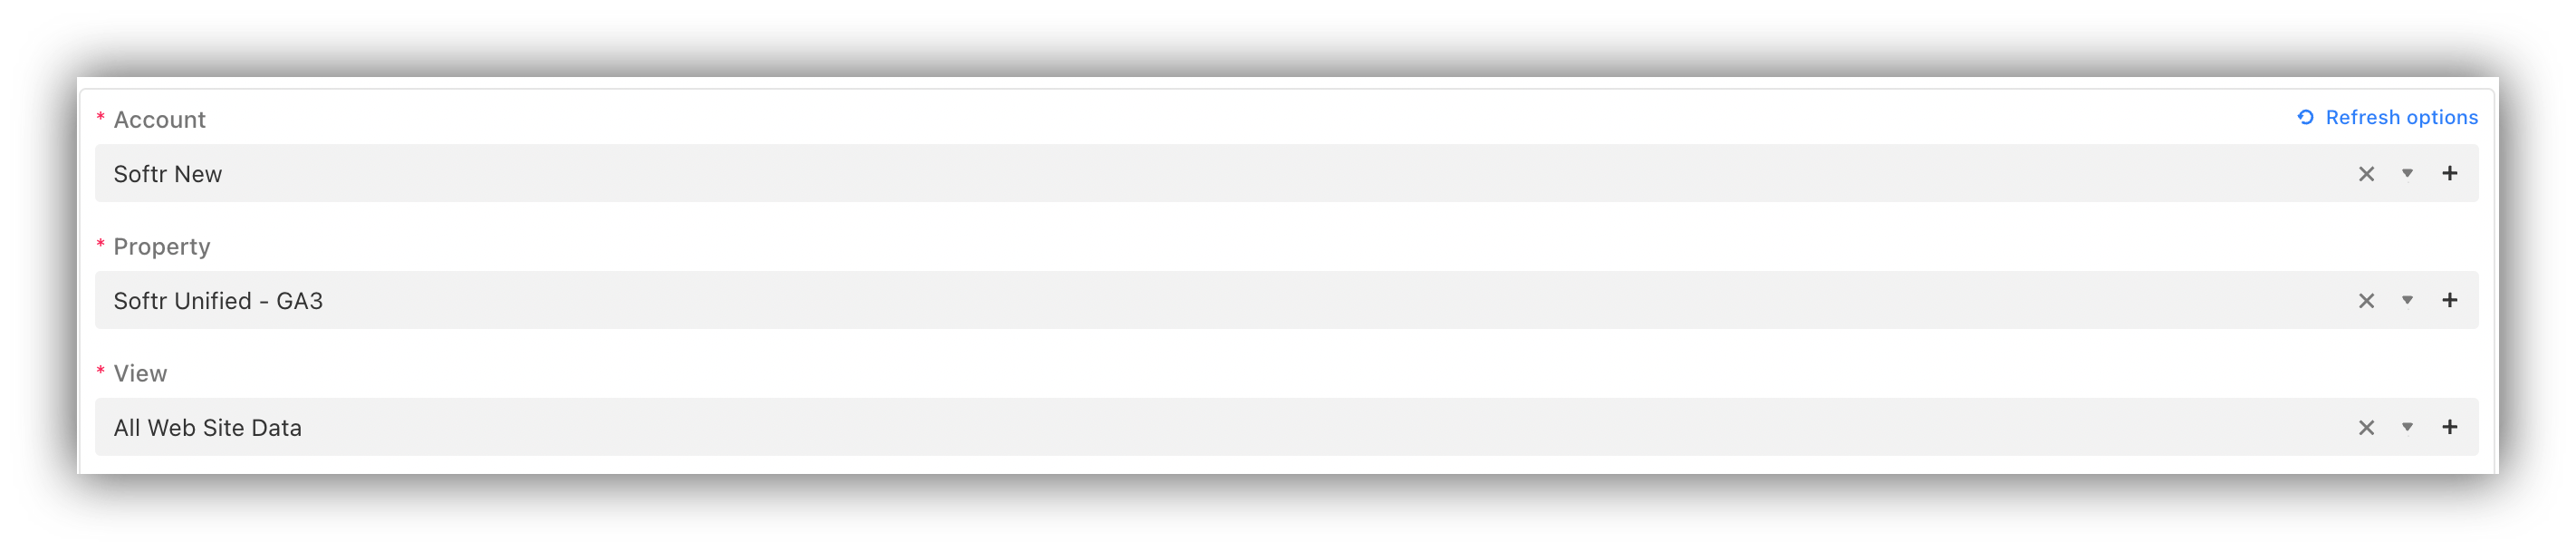
Step 7: Select the Google Analytics Account, Property, and View your data will be imported from.
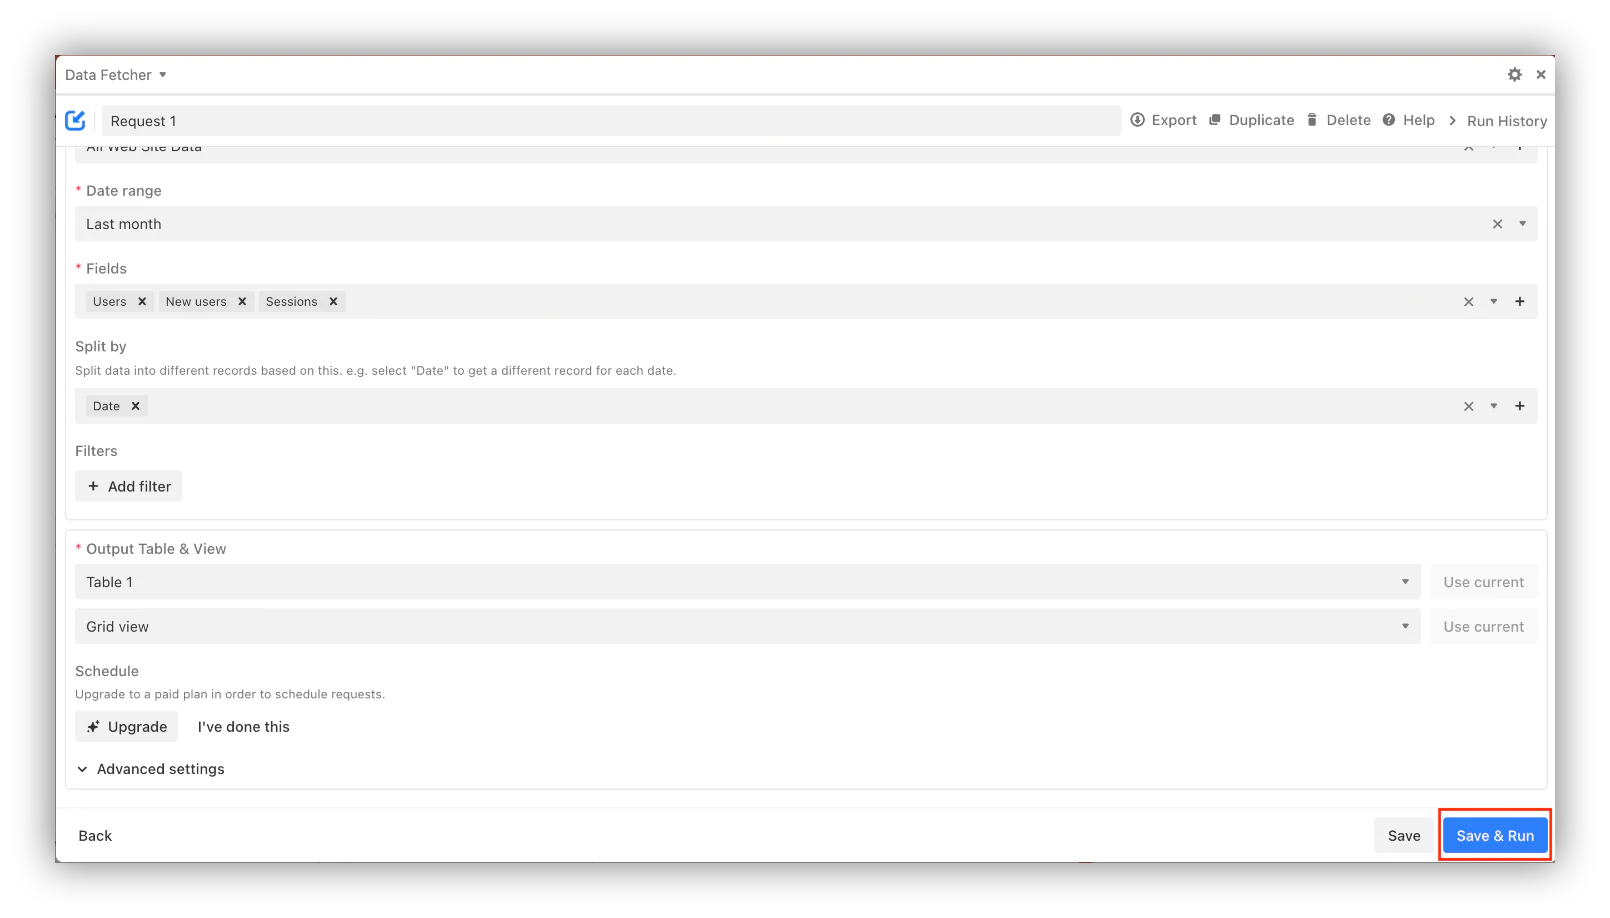
Step 8: Choose the Date range you want to import data for.
Step 9: Select the Fields you want to import from Google analytics.
In our case, we went for the Data range of last month and the data of the Users, New Users, and Sessions to be imported.

Step 10: Select a value for Split by to split the data into different records. We’ve selected "Date" to get a different record for each date.

Step 11: Select the Output Table & View you want to import Google Analytics data into.

Step 12: Click 'Save & Run'.
The request will run and the Response field mapping tab will open, where you can select how GA fields should be mapped to Airtable fields. The Google Analytics fields can be imported or filtered. The imported fields can be set to be mapped to an existing field or a new one.
Once you’re done with mapping, click 'Save & Run'.

Data Fetcher will create the fields in the output table, running the request and importing the data from Google Analytics to Airtable successfully. If you want to run the request again, simply click 'Run'. If the fields remain the same, you will not need to set up the response field mapping again.
These were all the steps required for syncing Google Analytics with Airtable manually and for free.
Import Google Analytics data to Airtable Automatically
Data Fetcher also has a premium schedule request feature that allows syncing Google Analytics and Airtable automatically.
Step 1: In Data Fetcher, scroll to Schedule and click 'Upgrade'.

A new tab will open where you can get familiar with plans, selected one, and add payment details to proceed.
Step 2: When you’re done with the payment process, simply go back to Data Fetcher and click "I've done this".

Step 3: Click 'Add API key'. You can find your API key in your Airtable account.

Step 4: Enter your Airtable API key and hit 'Save'.
Step 5: Toggle on Schedule this request.

Step 6: Select how often you want the request to run and click 'Save'. This way, the request will run automatically according to your set time.
Automate the import with workflows (Softr, Zapier, or Make)
If you plan to build your dashboard in Softr, the simplest path is to use native Softr Workflows. Because they are triggered directly by UI interactions in your app (like an action button or a form submission) and run against your connected data, they keep the refresh logic in the same place as your reporting. Softr also has native integrations for Airtable, so the data and the automation stay in sync.
If you prefer a standalone automation tool, Zapier and Make both connect Google Analytics to Airtable, and Softr can read the result either way.
Using Zapier
Zapier is one of the best no-code automation tools, and if you are looking for a free and automatic way of syncing Google Analytics data with Airtable, it is a solid choice. The process can feel complex for first-time Zapier users, but we will walk through the steps clearly. Let's get started.
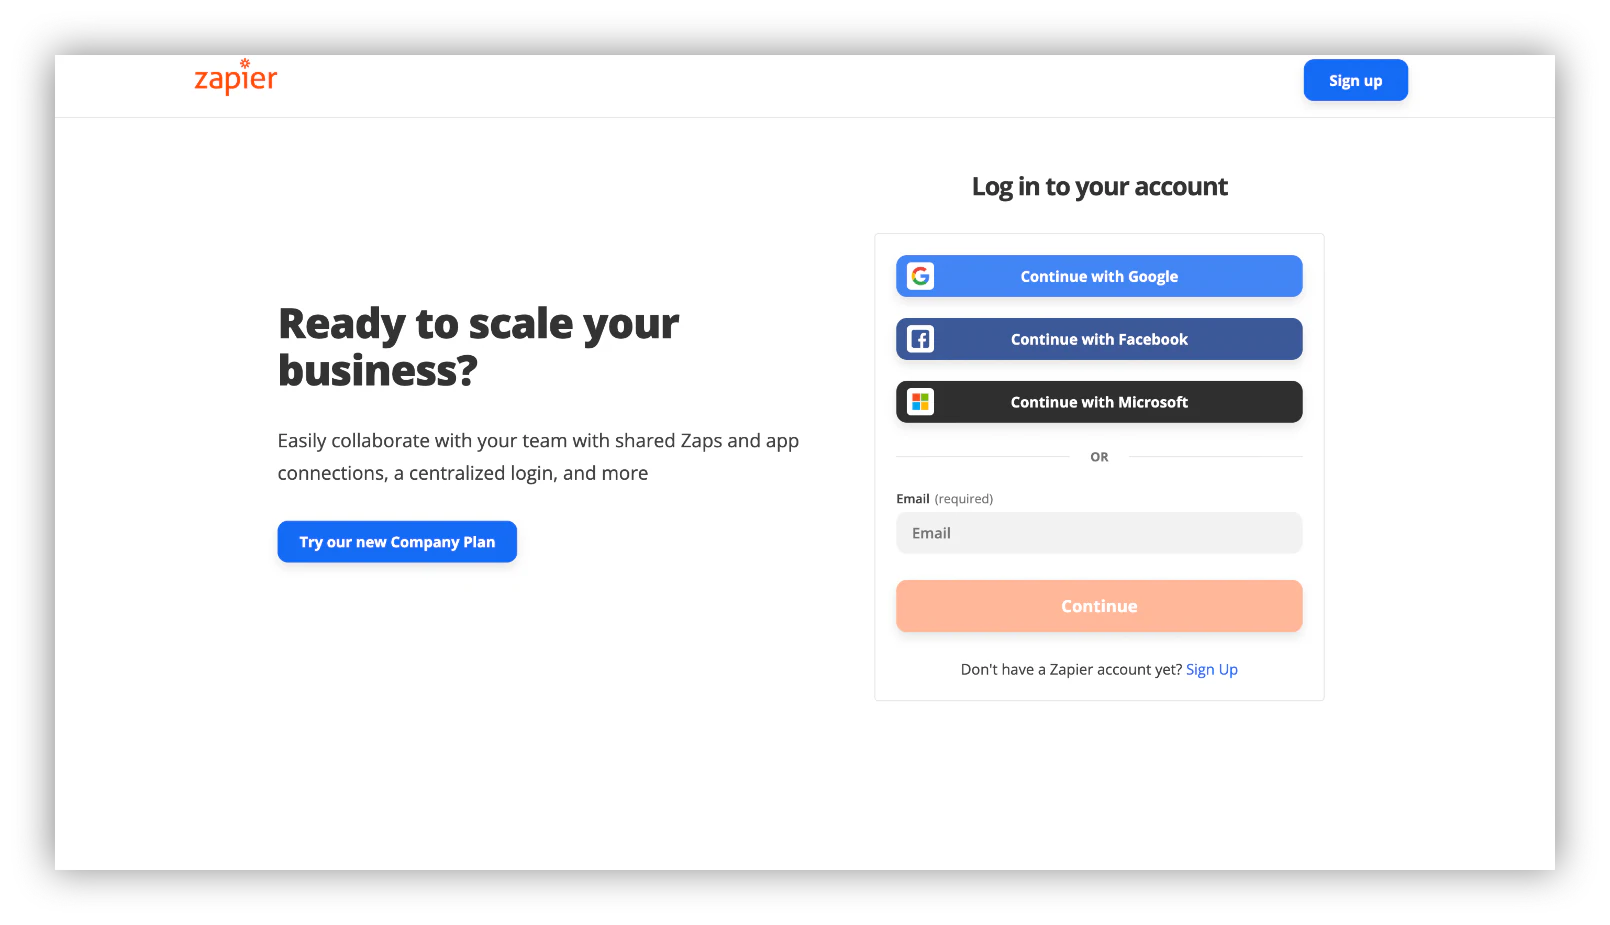
Step 1: Go to Zapier sign-in/sign-up page.
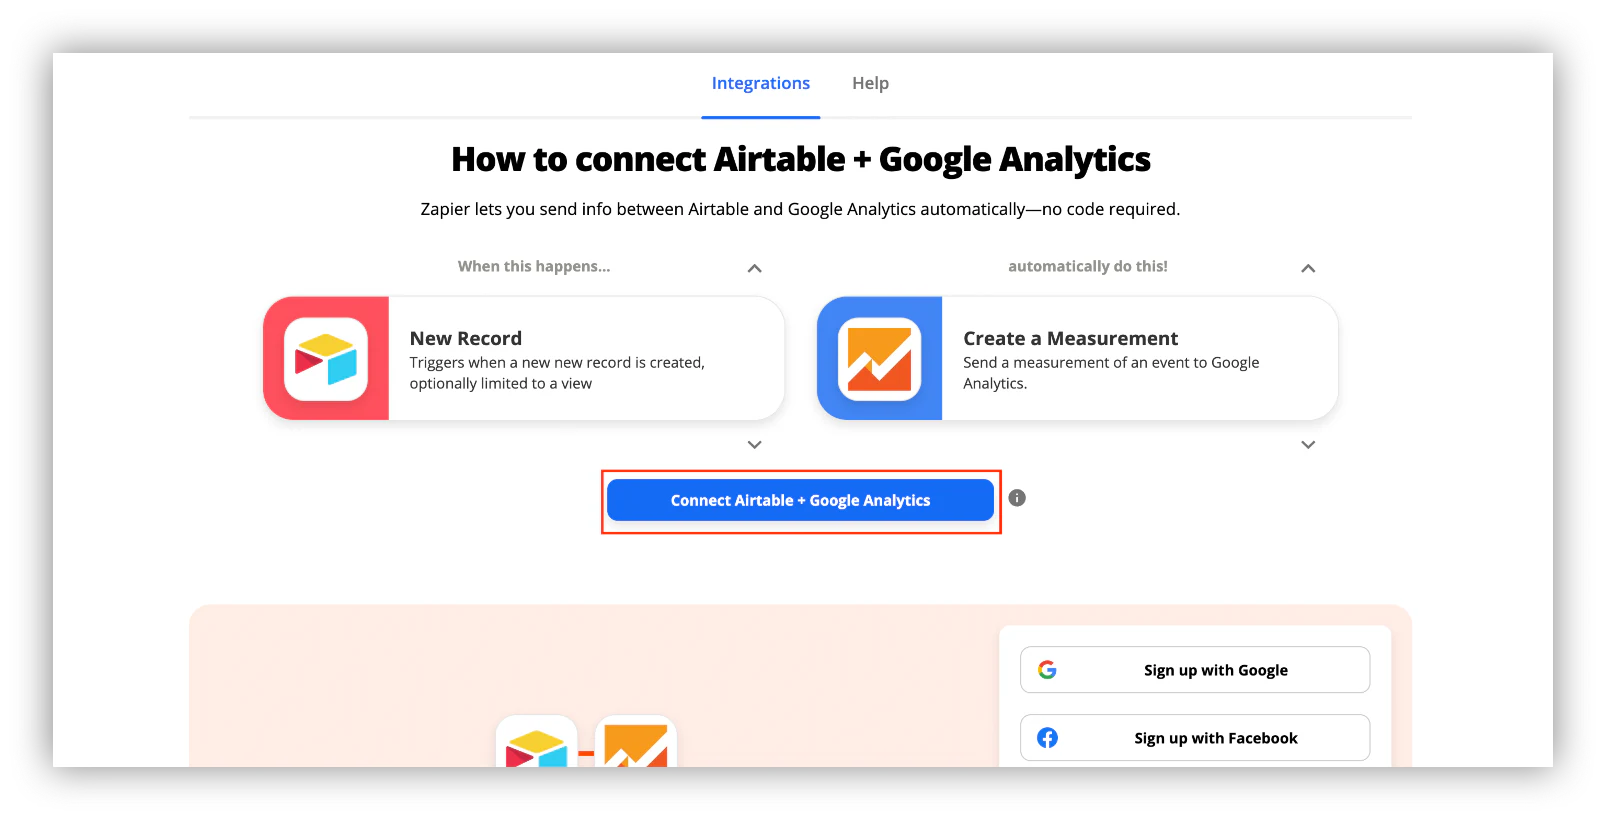
Step 2: Go back to the Google Analytics x Airtable page and click on the “Connect Airtable + Google Analytics” button to get started.
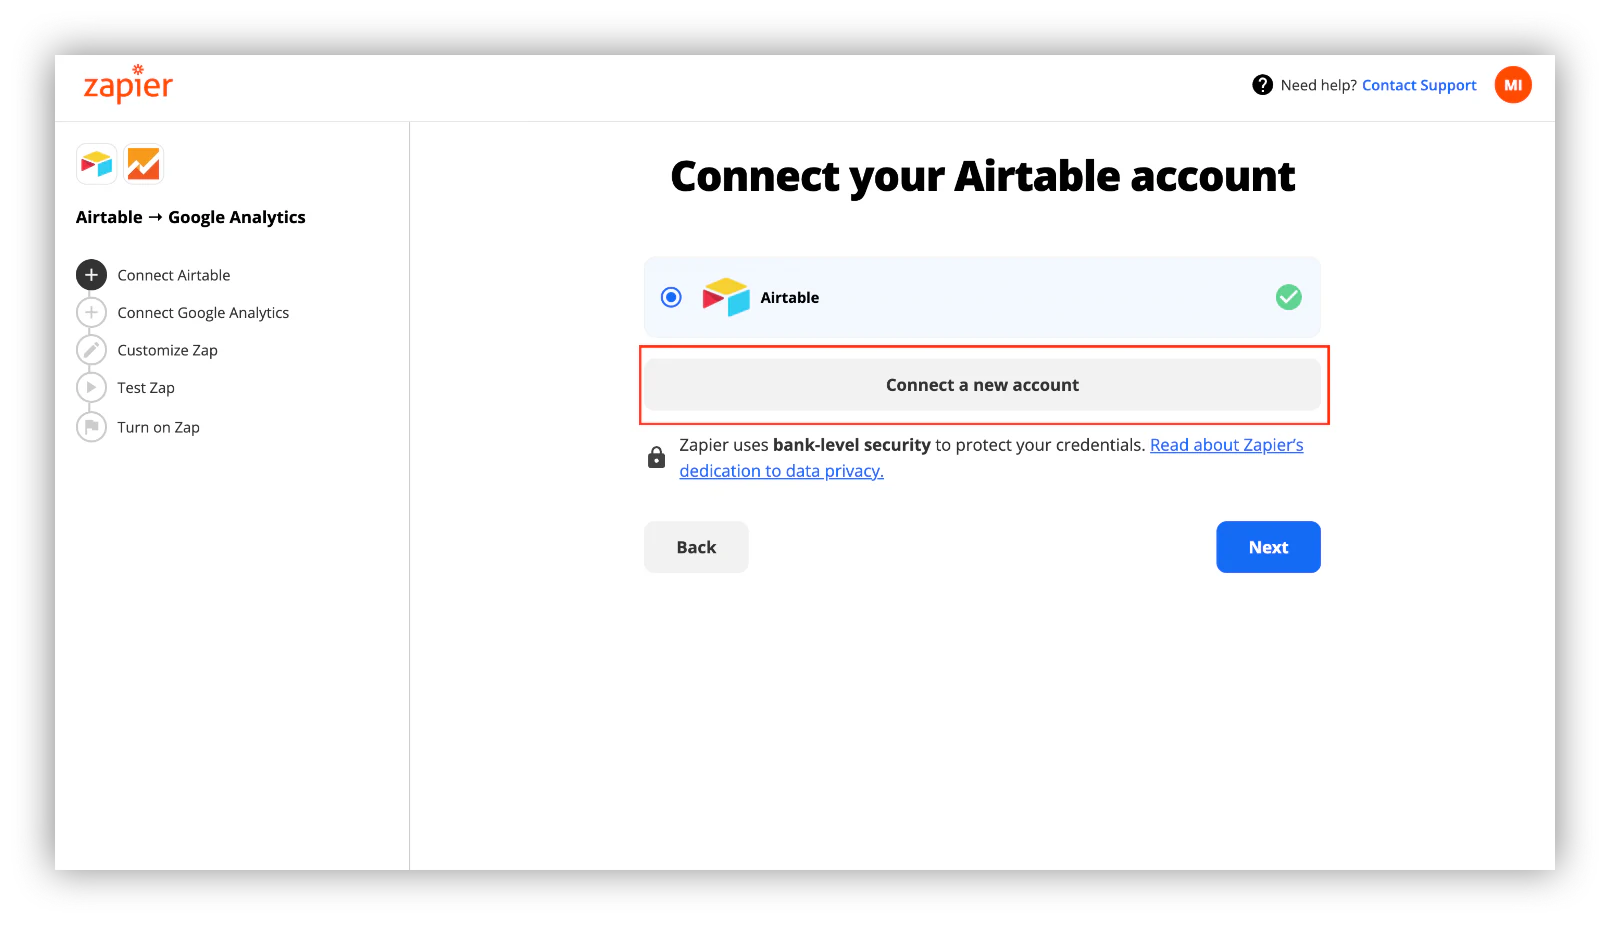
Step 3: On the opened page, click on “Connect a new account”.
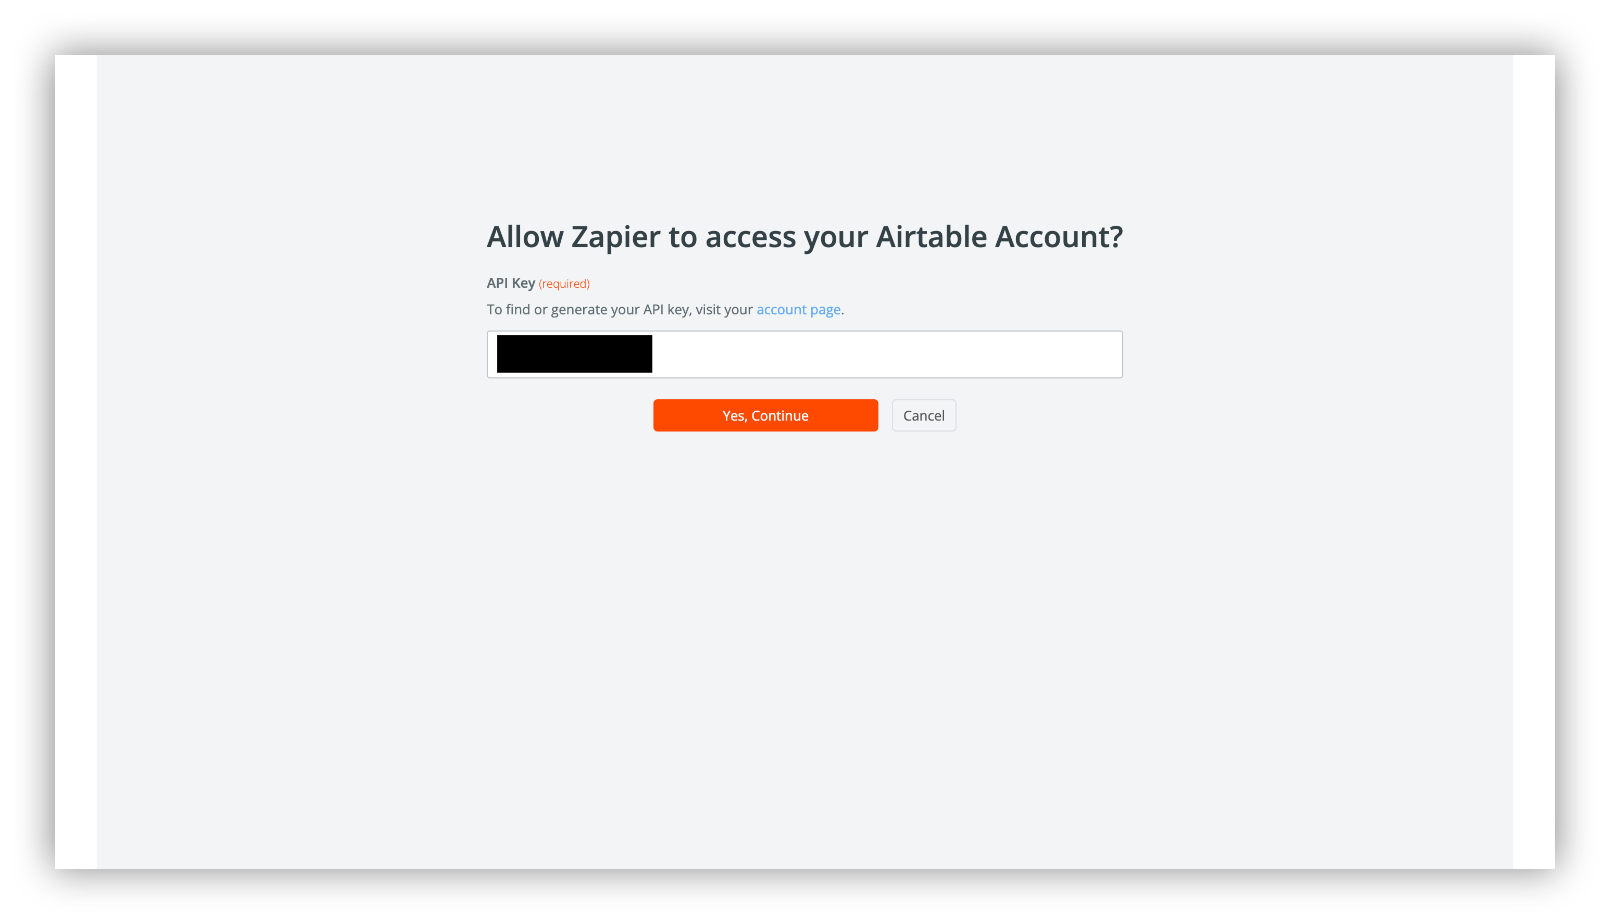
Step 4: On the opened tab add your Airtable API.
You can copy your API key from your account page.
Step 5: Click “Yes, Continue”, after you add your API key.
Step 6: Choose a Base, a Table and a Grid view you want the data to be imported.
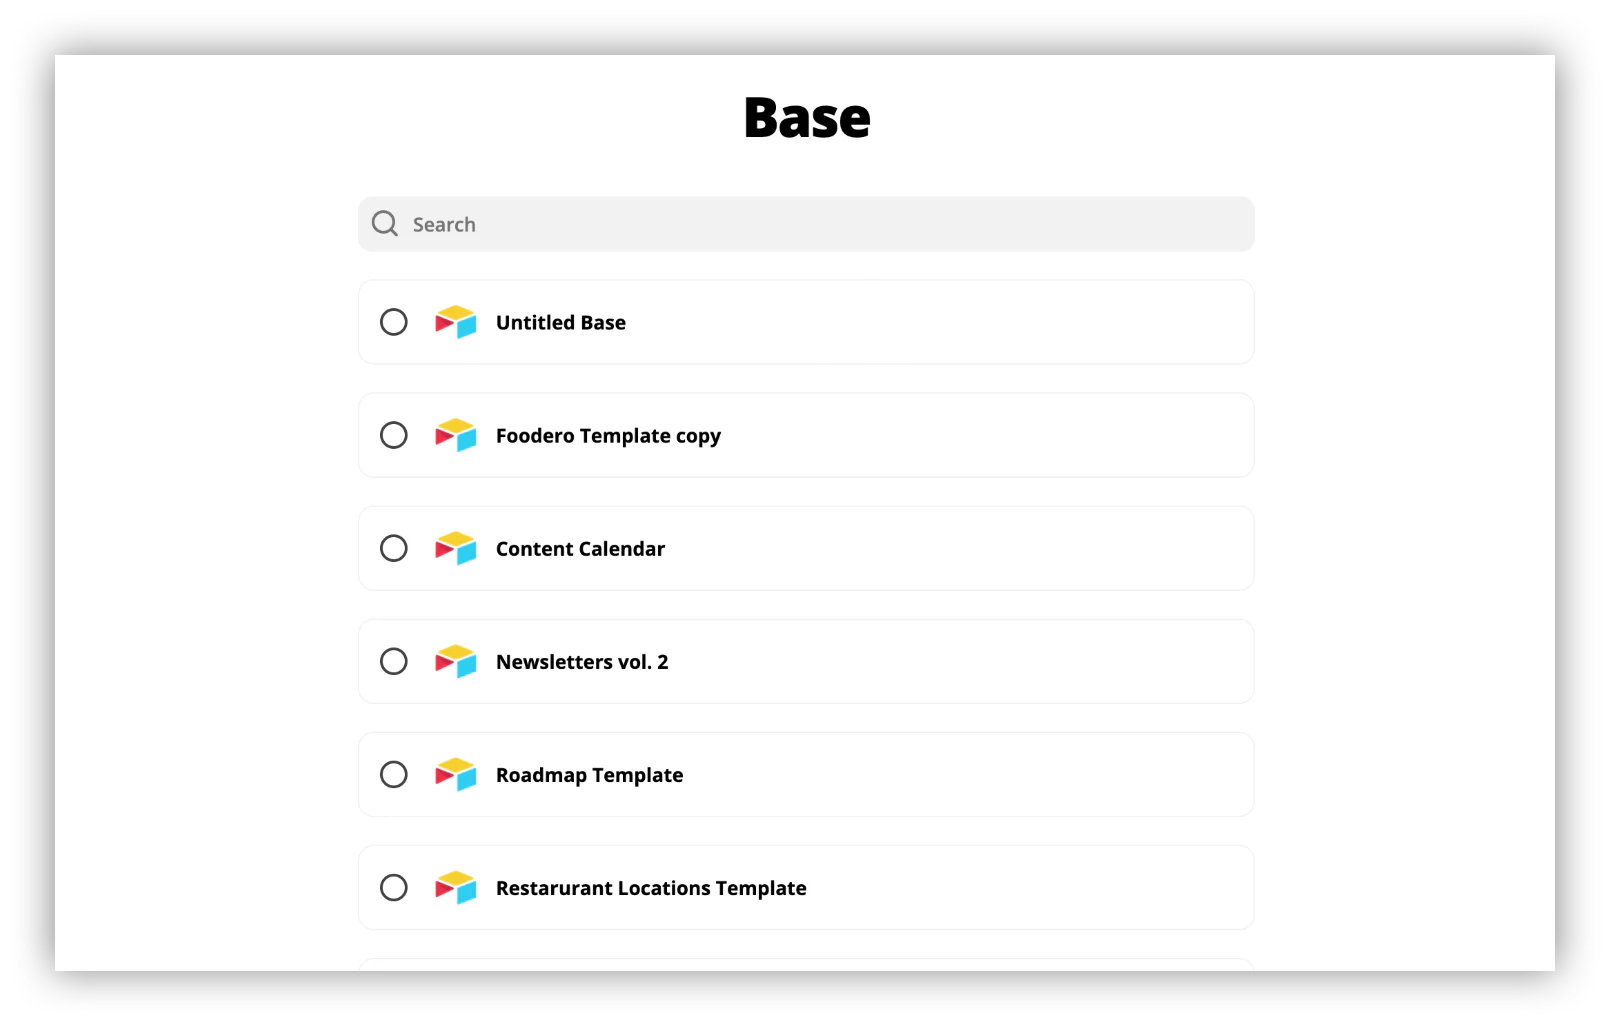

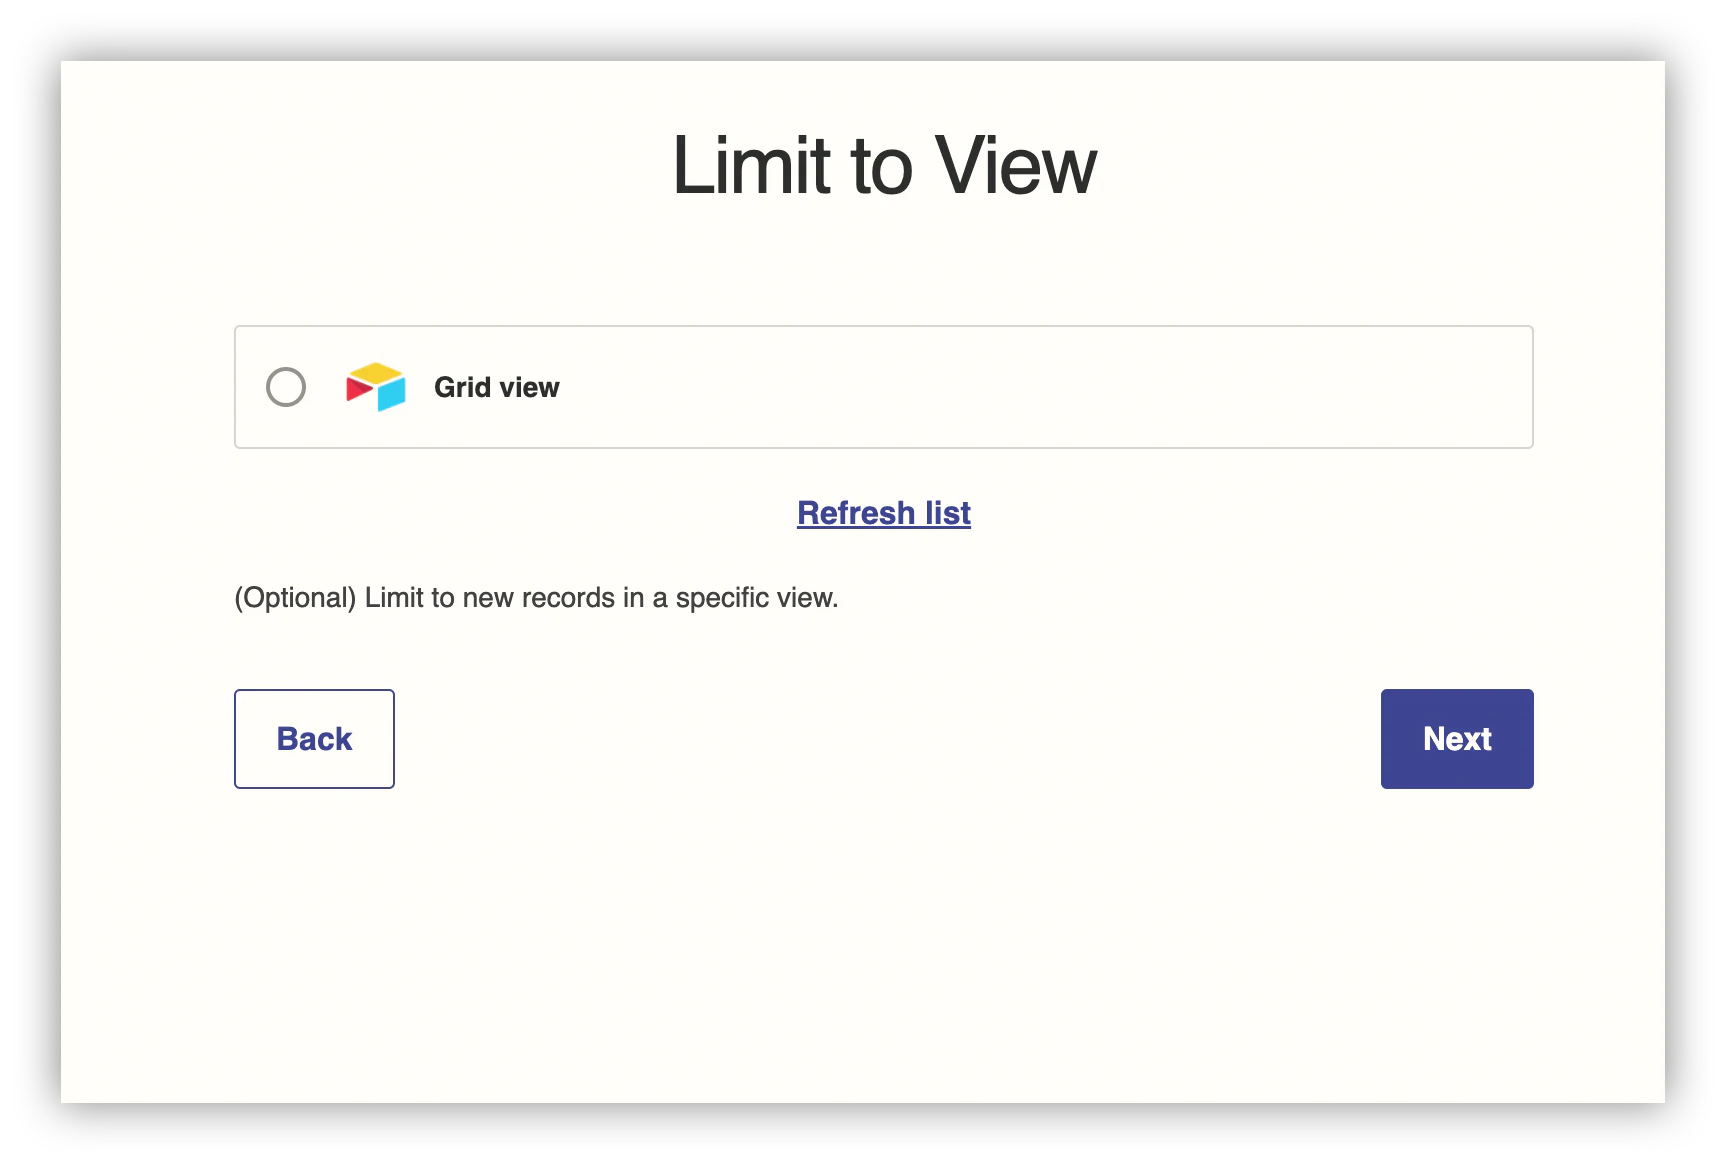
Congrats! You have successfully integrated Airtable with Zapier. The second step of the syncing process is connecting Zapier with Google Analytics.
Step 1: Click “Connect”, to start the process.
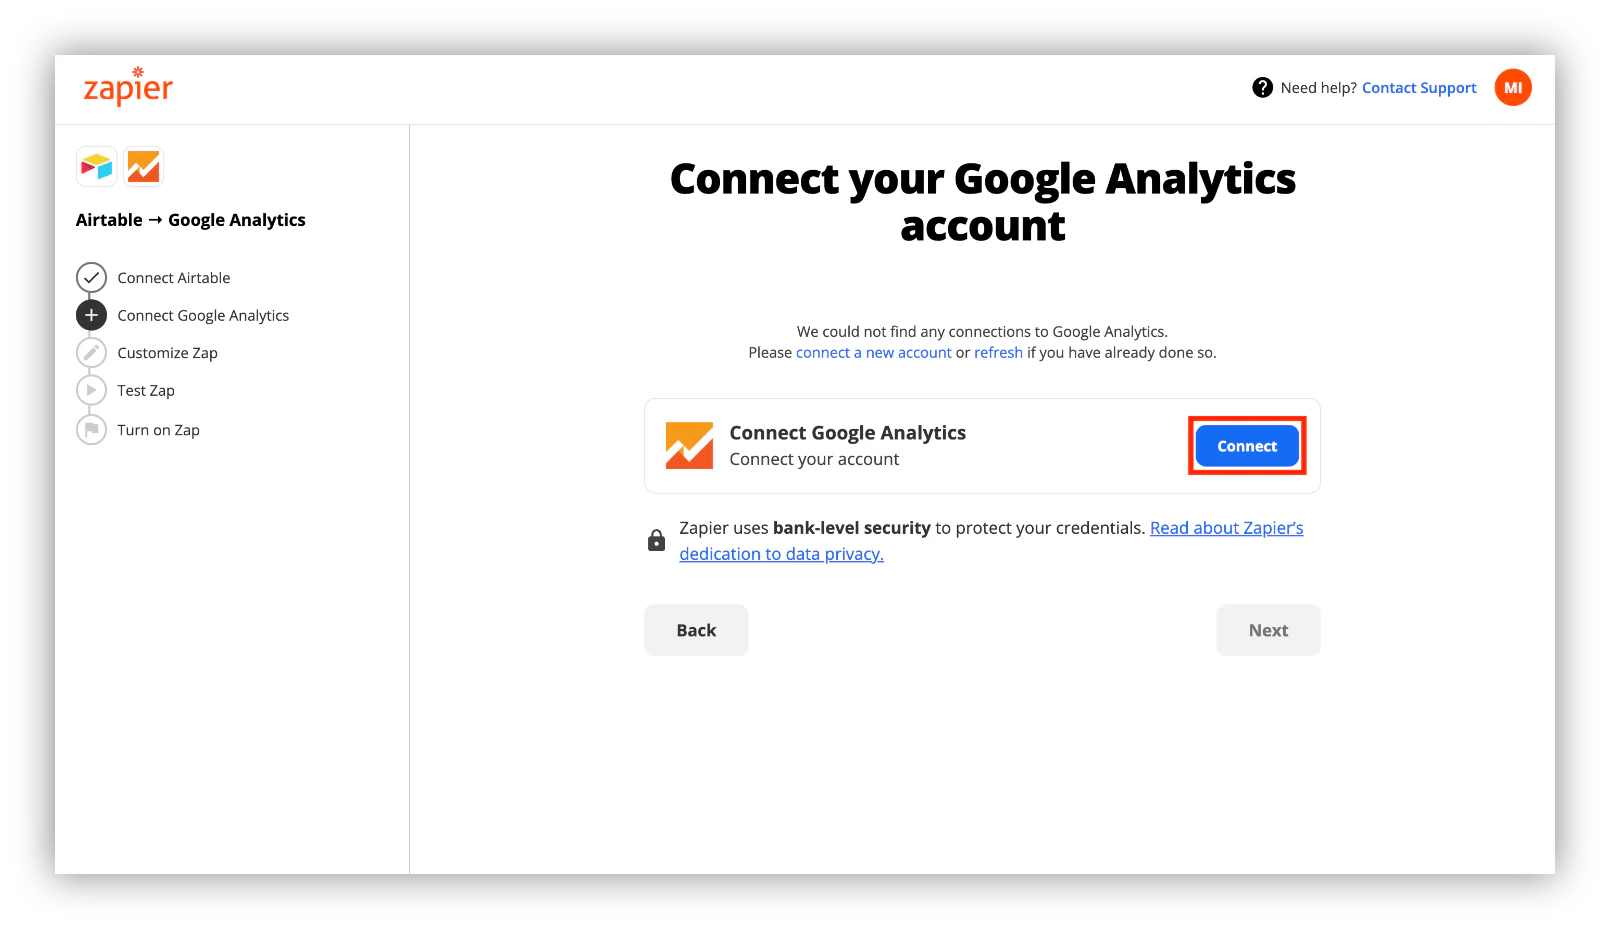
Step 2: Choose a Google Analytics account you want to connect to Zapier.
Step 3: Click “Allow”, for Zapier to access your data.
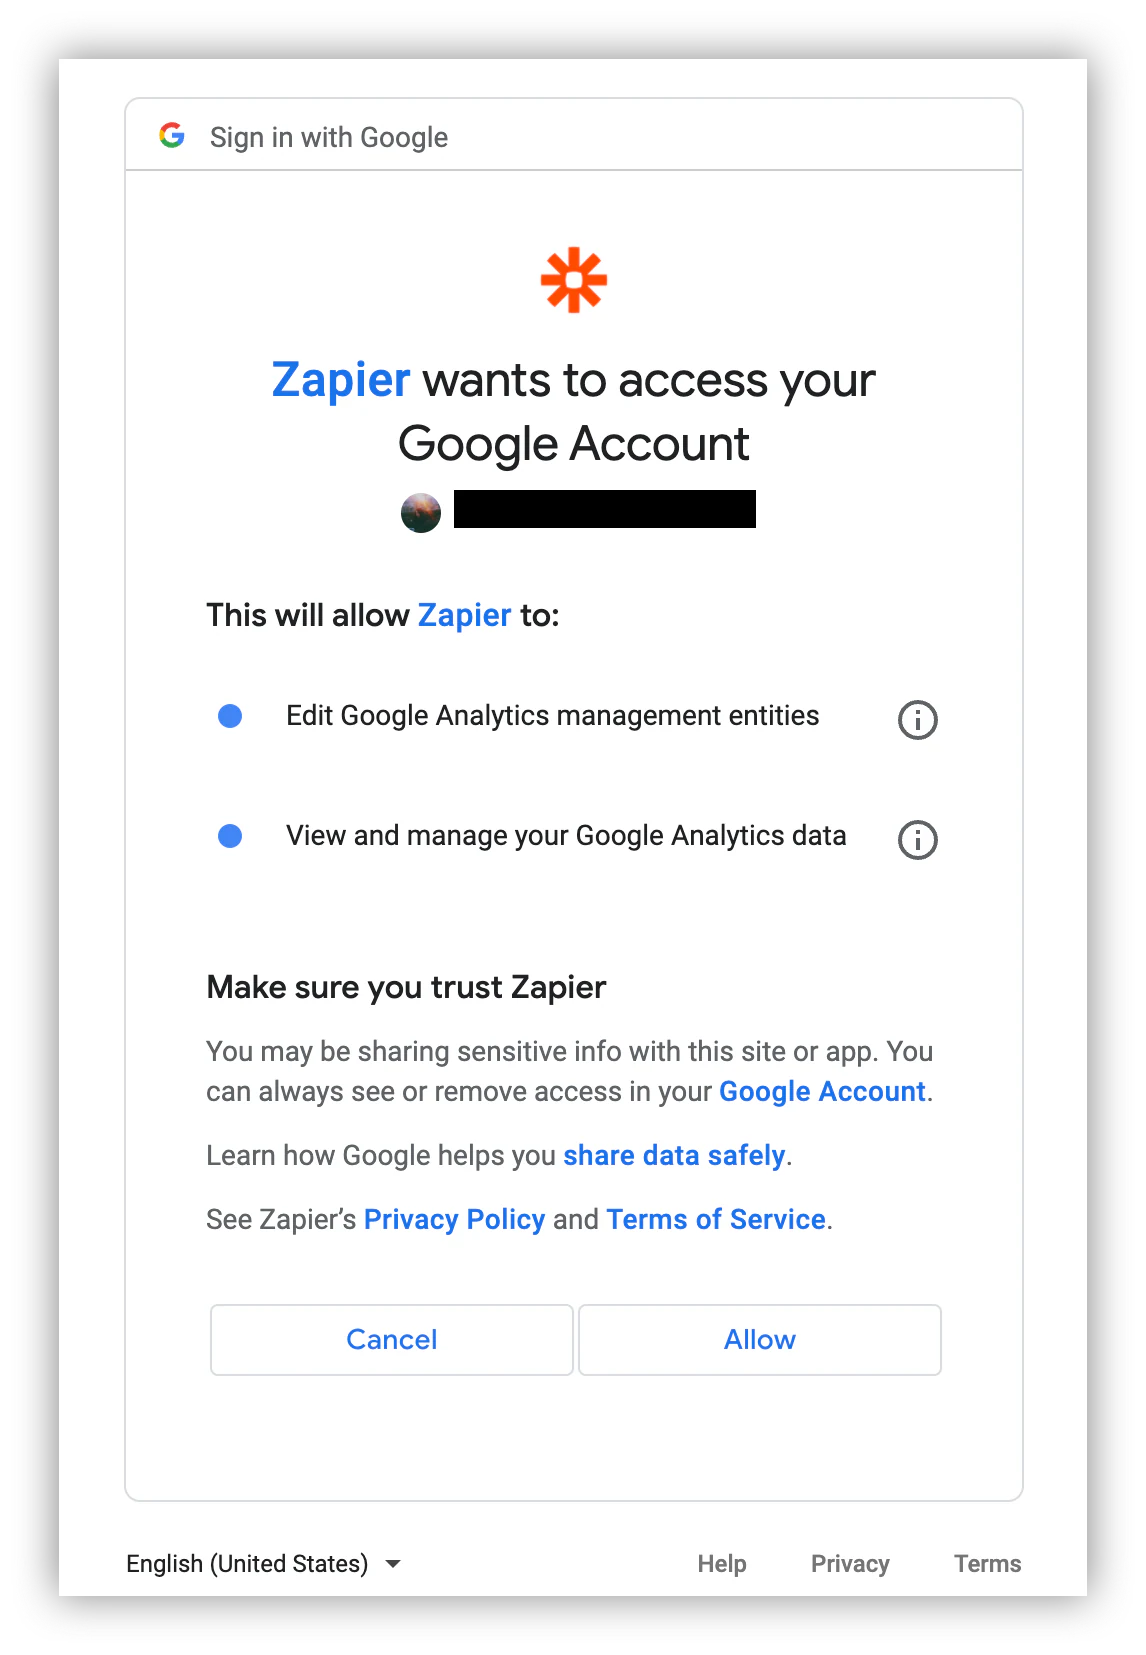
Step 4: You will be directed to the connecting page, where, by clicking “Next”, you will resume the syncing process.
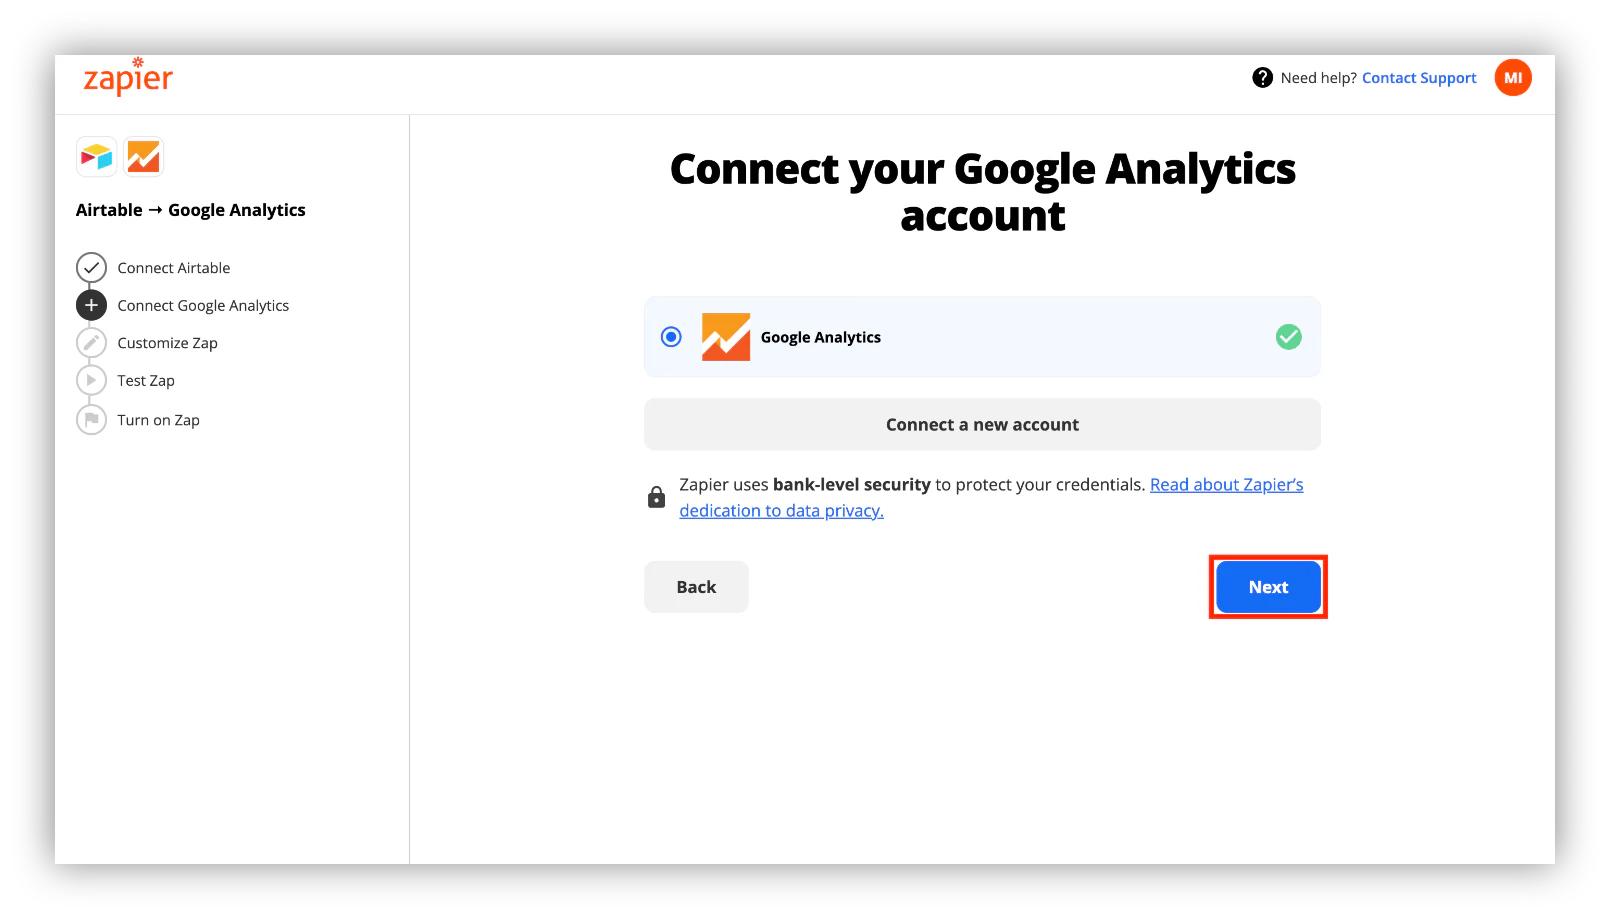
Step 5: Choose a Google Analytics account, property, and type.

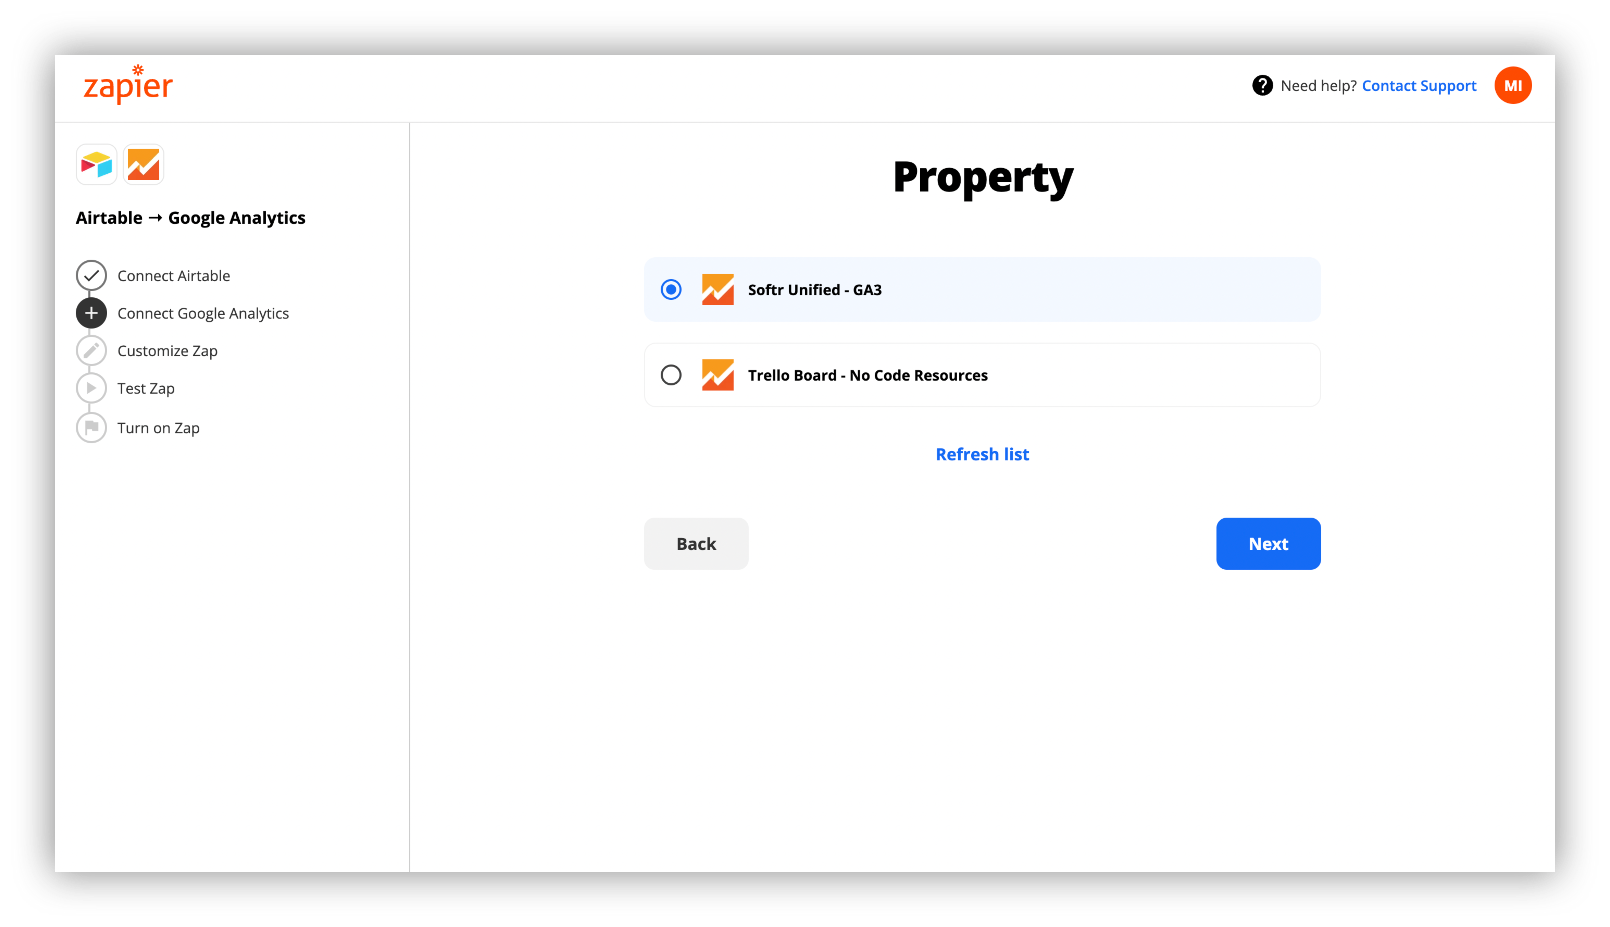
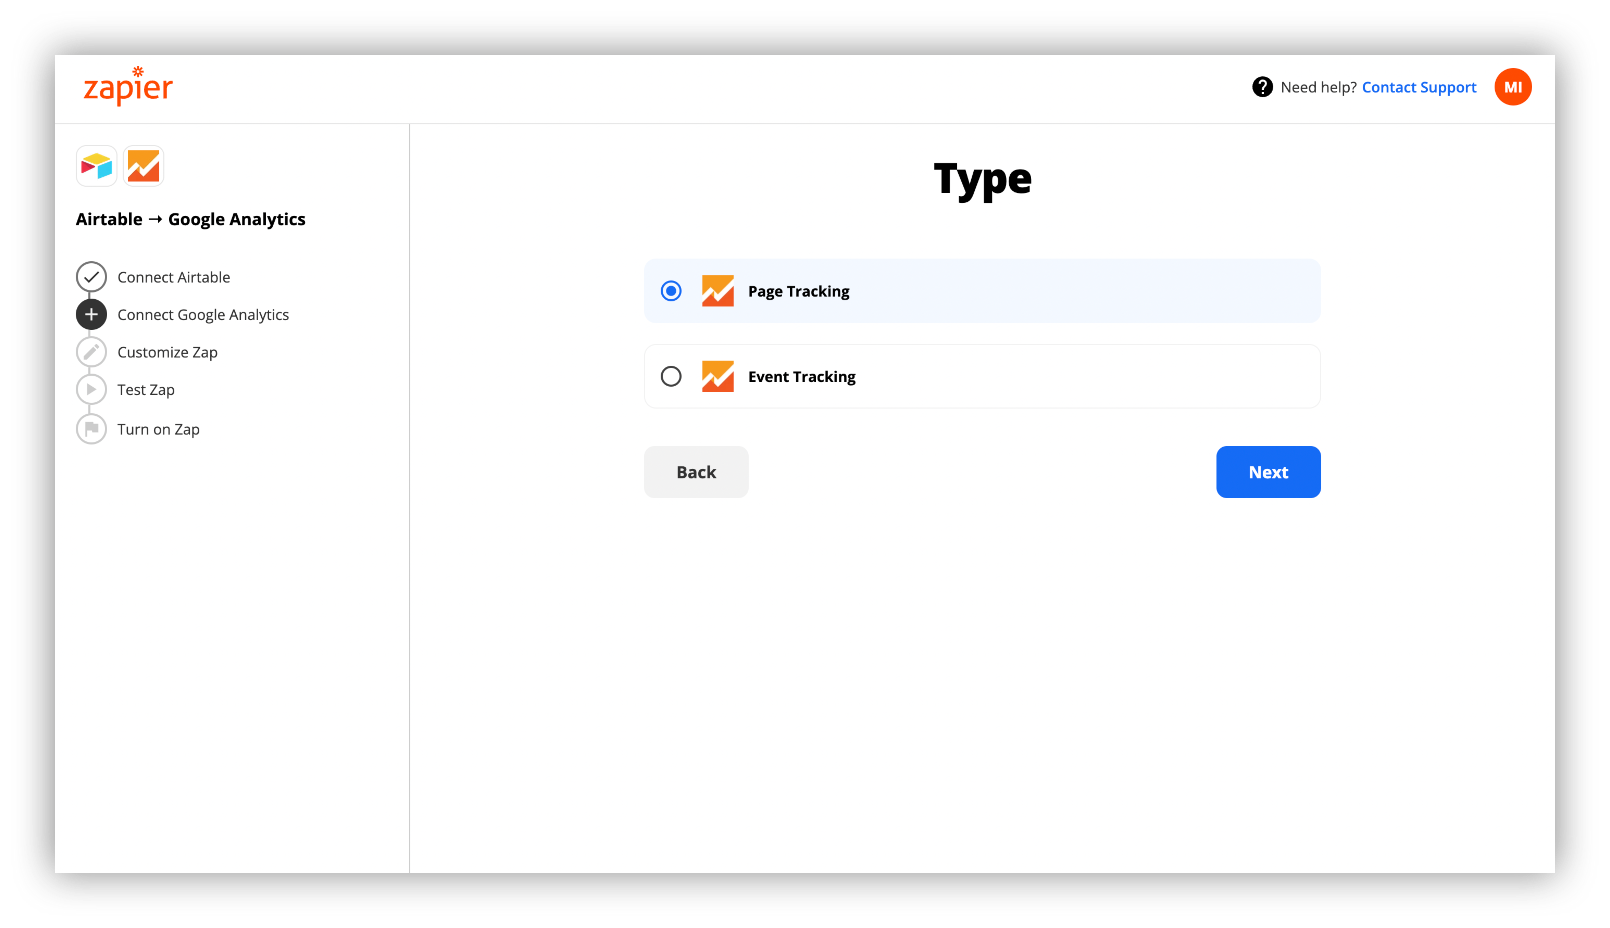
Step 6: Select the fields you want to edit in Airtable.
We selected Name and Type.

Step 7: Click “Next” to move on to customizing Zap for the final step. For this step, you’ll need to map fields from Google Analytics into Airtable.
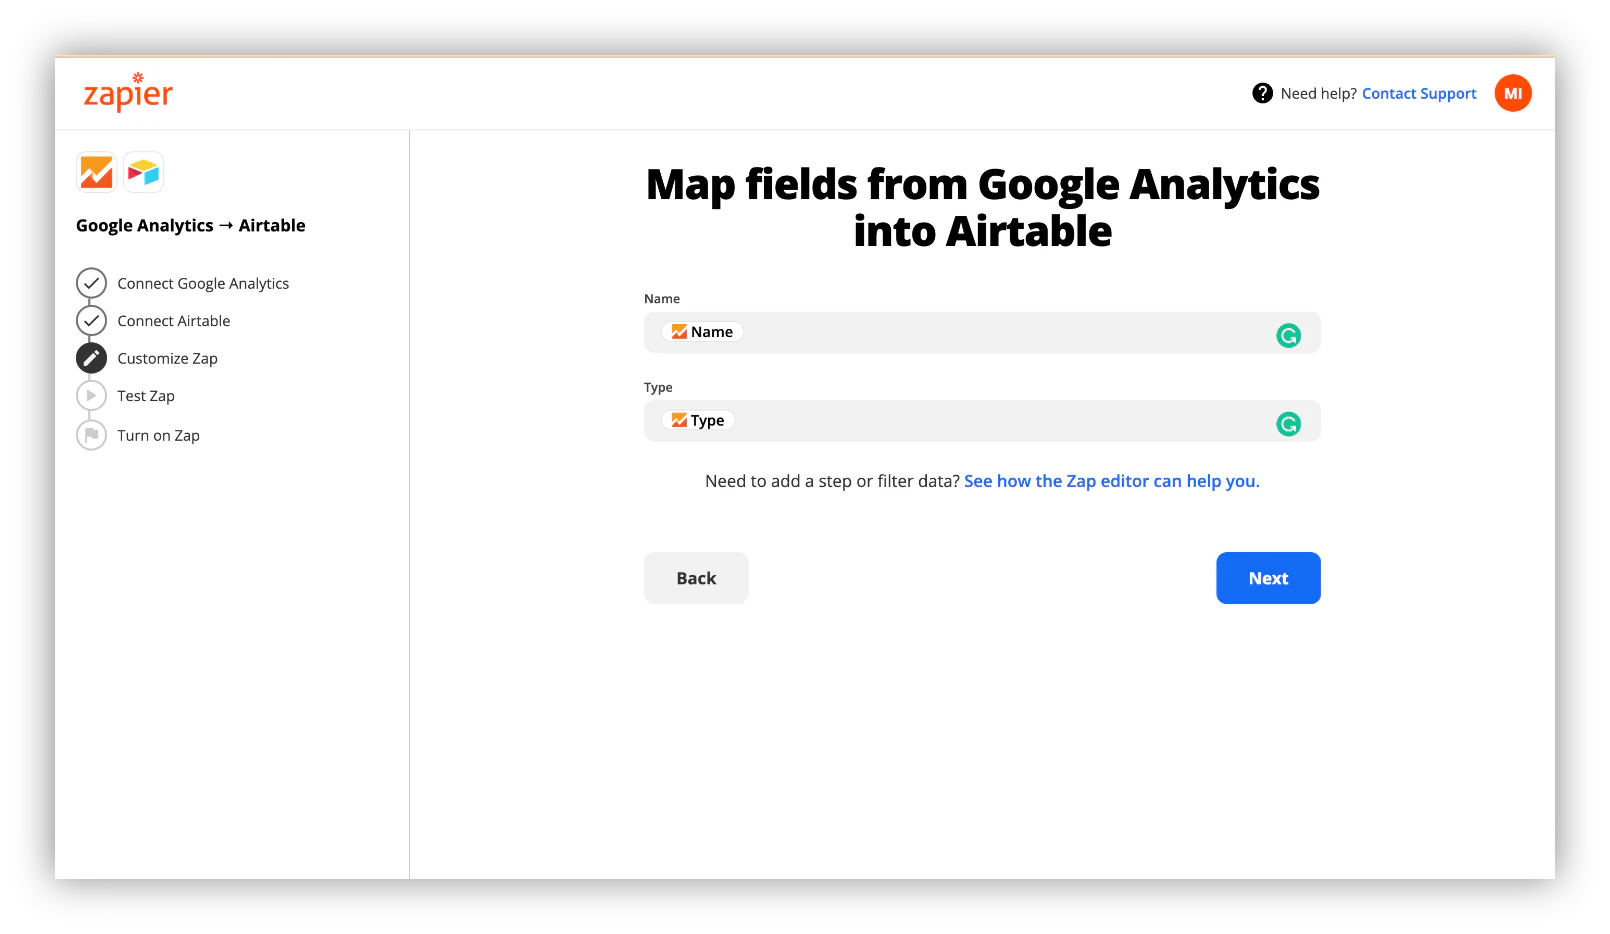
Step 8: “Send test” to test if you have successfully connected GA with Airtable.
Zapier will create a test record for you to check if the connection went smoothly.
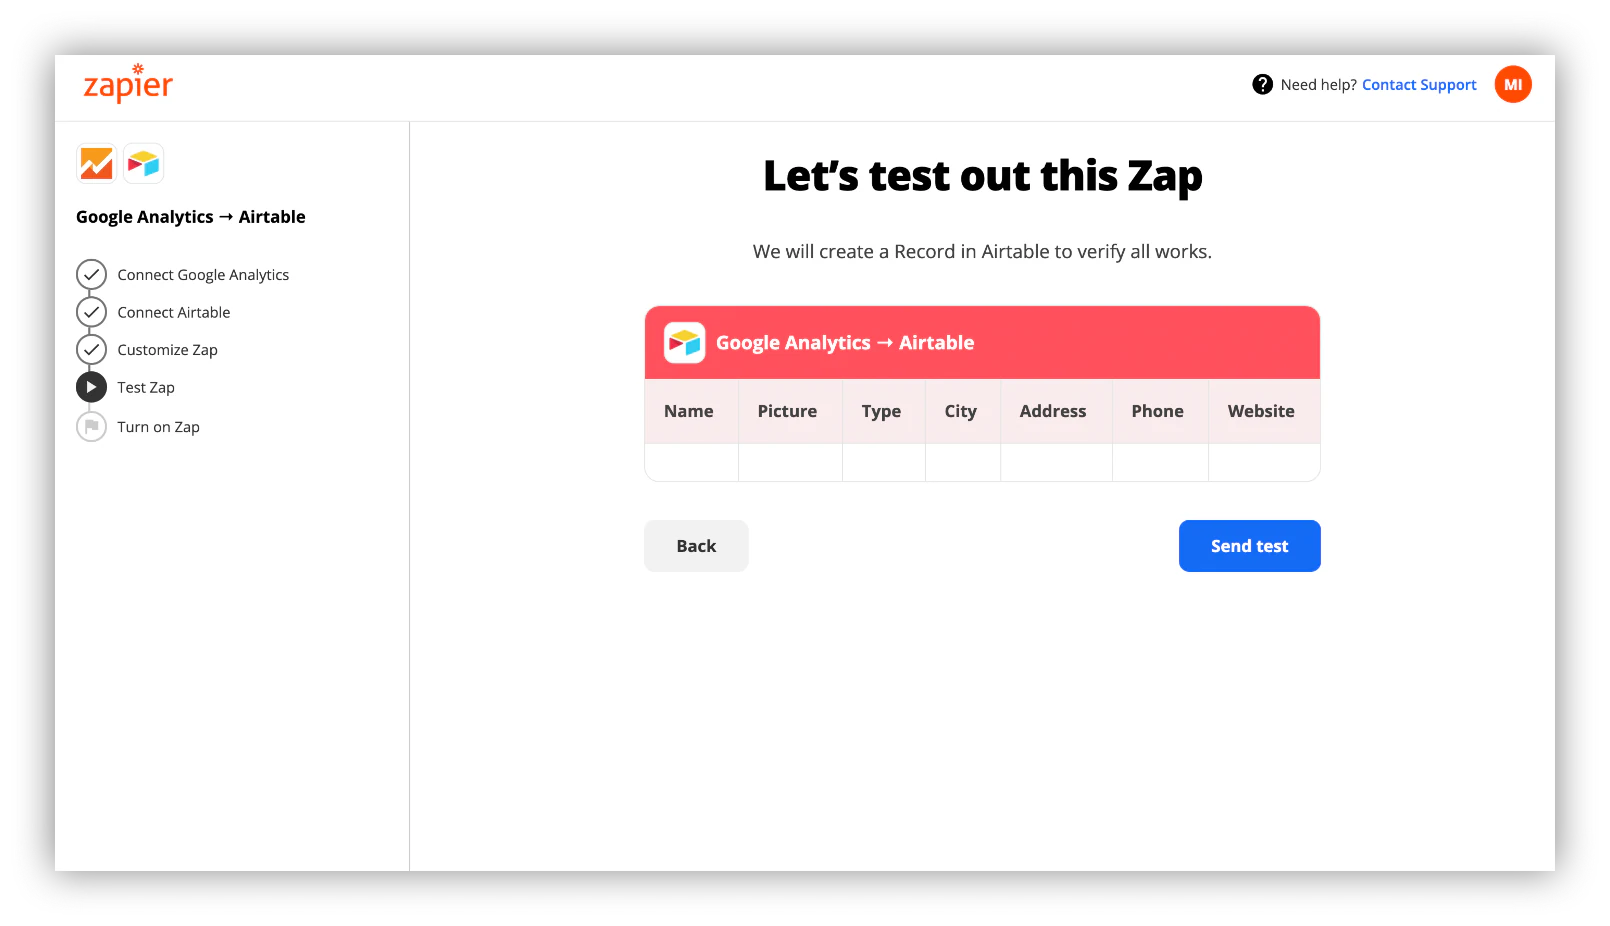

Step 9: After clicking next, you can Turn on the Zap to have your GA data automatically sent to Airtable.
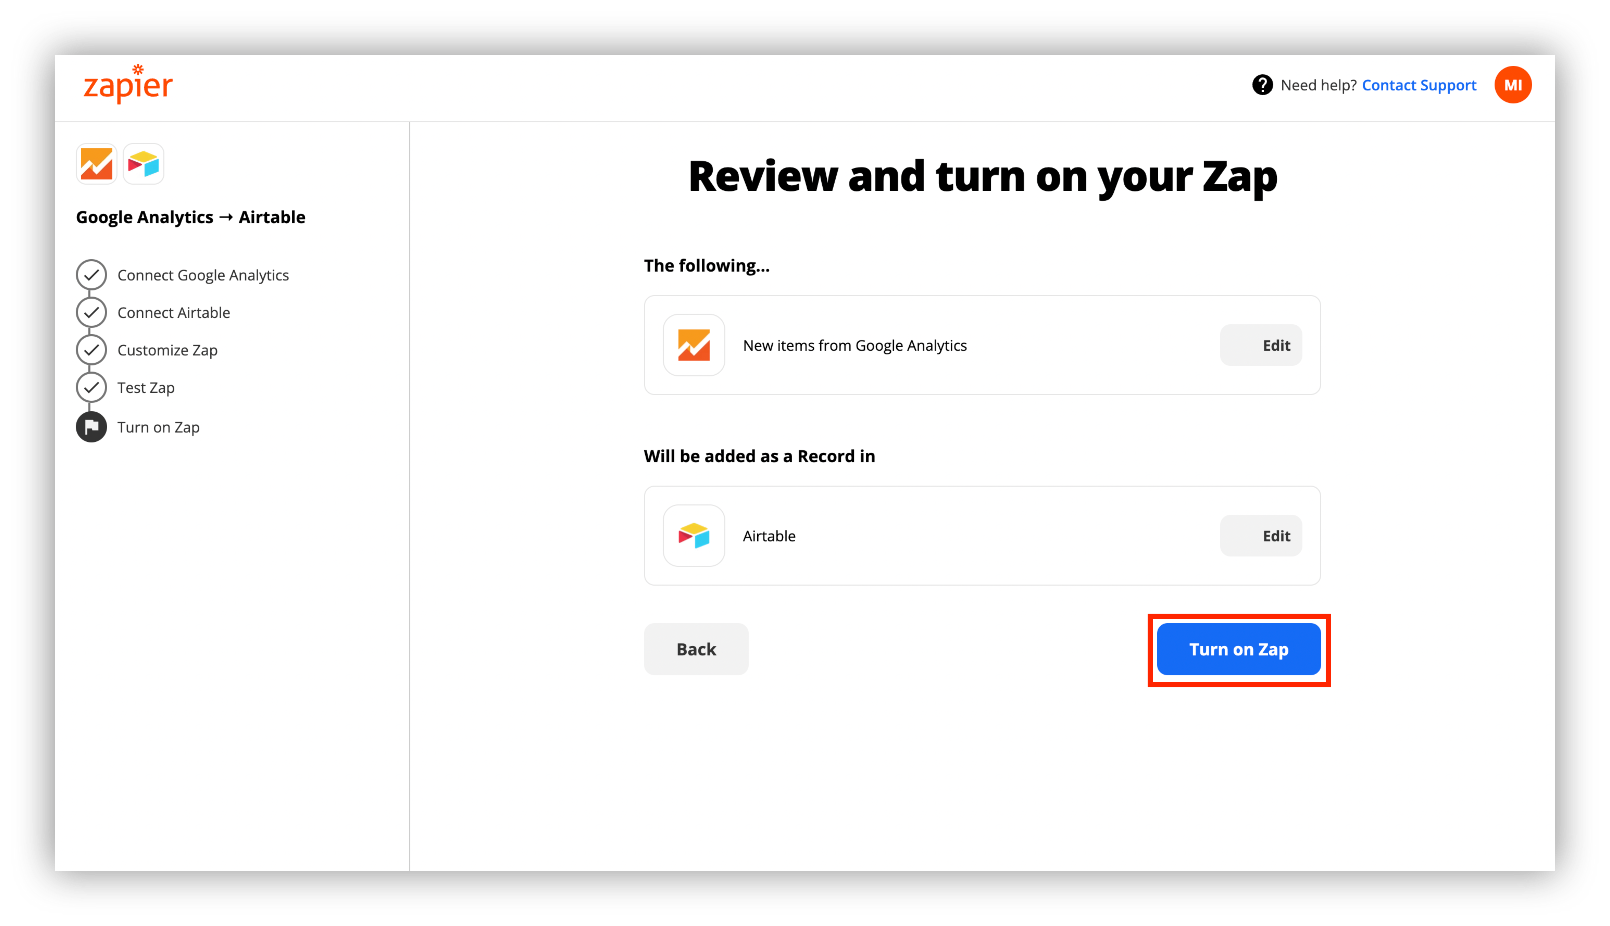
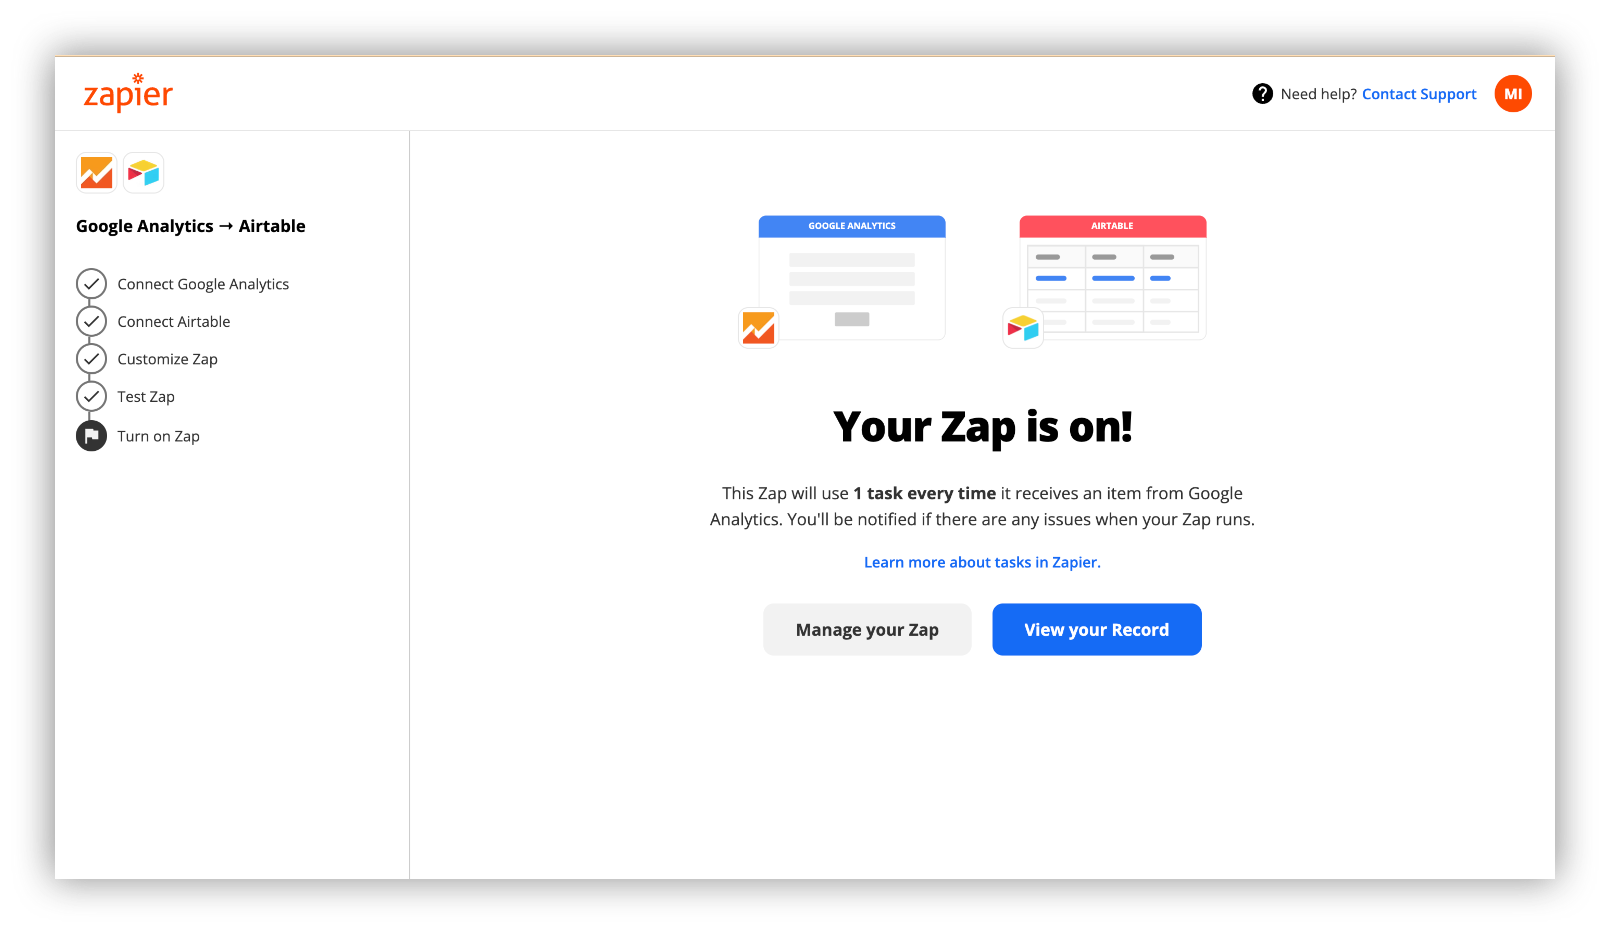
That would be it. You can always manage your Zap, turn it off/on, and even delete it if there is a need.
Using Make
Like Zapier, Make (formerly Integromat) is an automation tool you can use to sync Google Analytics with Airtable. The main difference between the two is the level of customization and difficulty. Zapier is easier, less technical, and less customizable, while Make is the better choice when you need fine-grained control and the steeper learning curve is not a problem for you.
Here is how you can import Google Analytics data to Airtable with Make:
Step 1: Sign up if you don’t have a Make account to proceed with the process
After you’re done signing up, you will be taken to your “My Organization page”
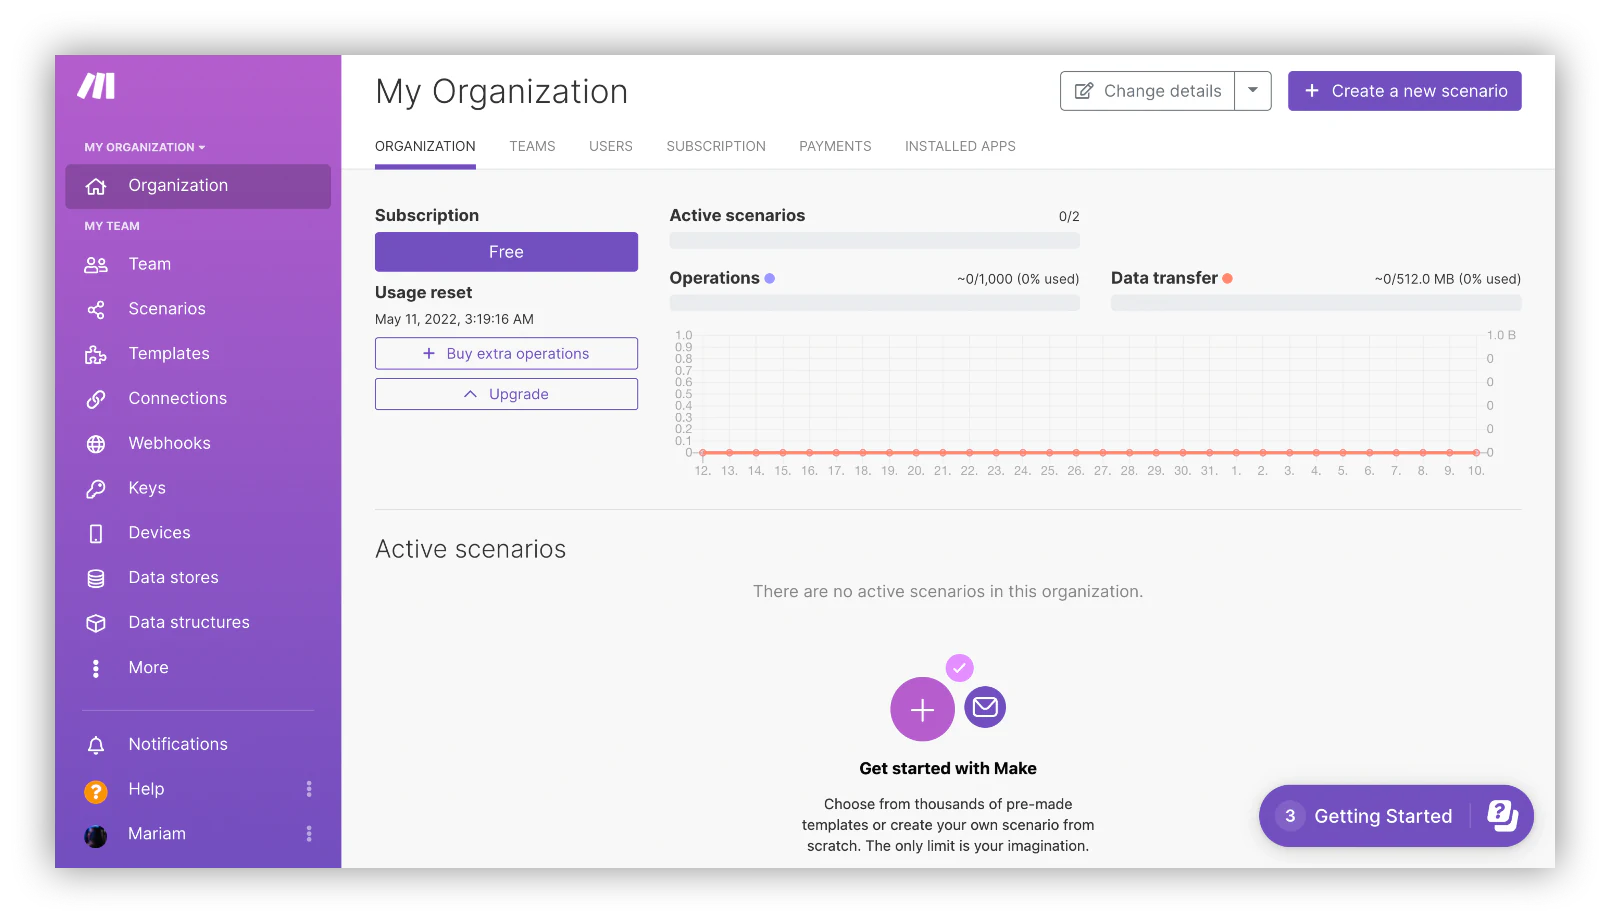
Step 2: In the right corner of the homepage, click “Create a new scenario” to start syncing Airtable and Google Analytics.

Step 3: A window will pop up where you can select a module (integrated platform) to build the scenario.
Step 4: Connect your Google Analytics account to Make.
- Click on the + button to search for Google Analytics module.
- Once you click on Google Analytics a new window will pop up where you should select “Get Analytics Report” option.
Step 5: Add a Google Analytics account.
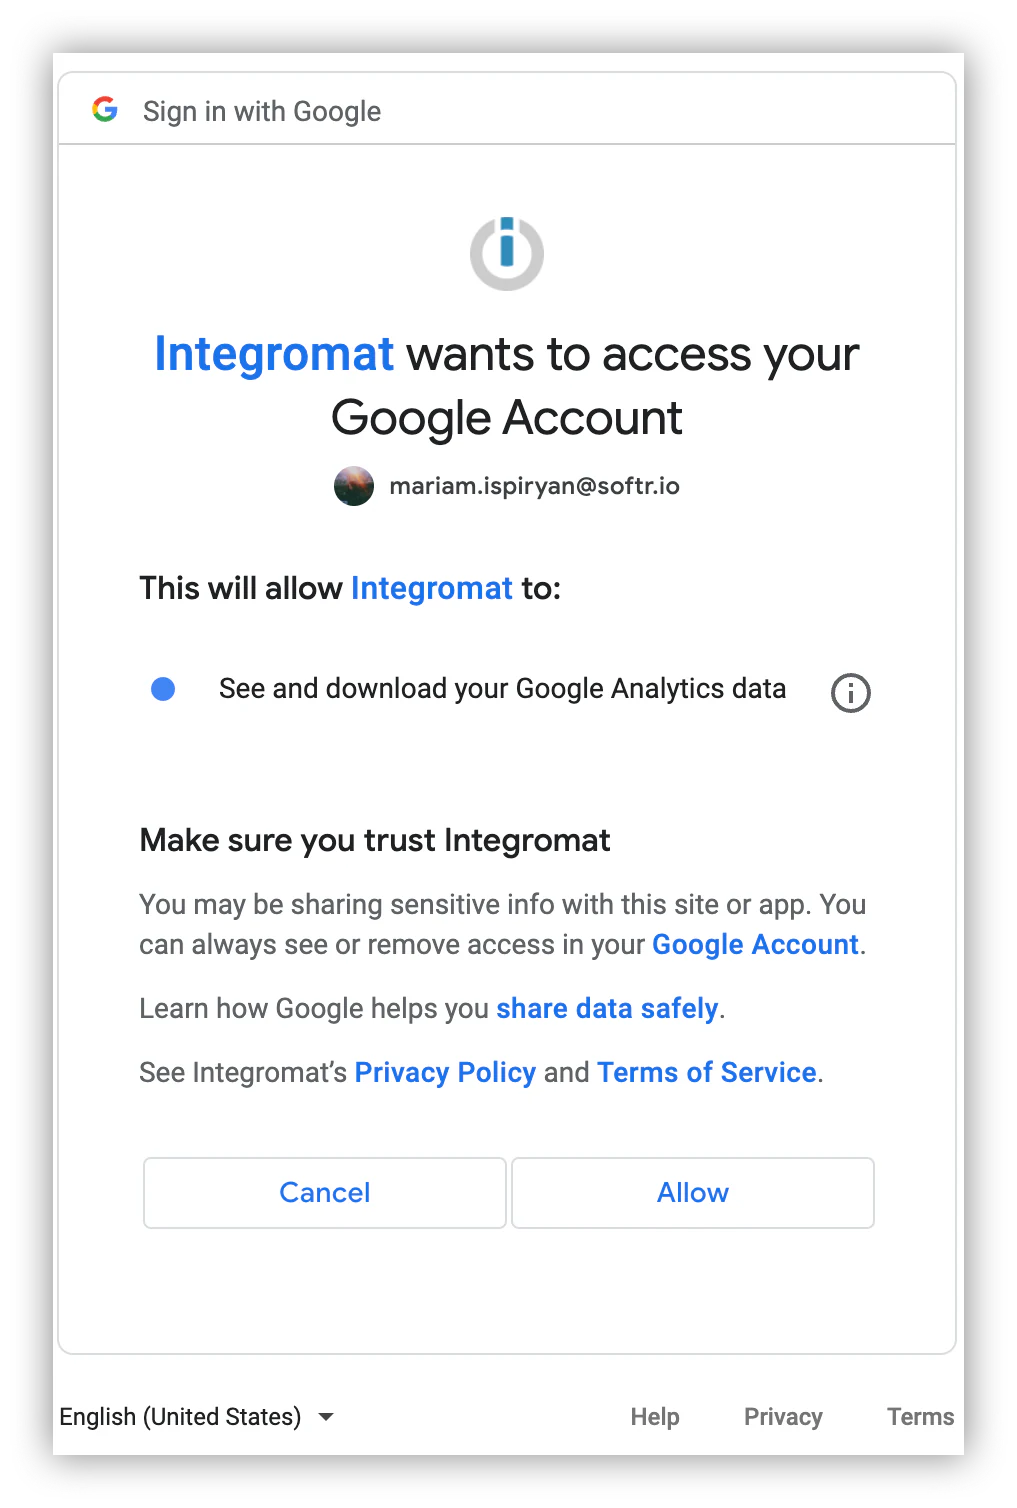
Step 6: In the opened Google Analytics module's dialogue, click the “Add” button and choose the account you want to connect to.
The following steps are mandatory for Make to be able to retrieve analytics data for the specified website. However, there are also optional steps available that can make the importing process more customizable. We recommend you take a look at Make’s Google Analytics documentation for more thorough guidance.
Step 1: Enter a View ID by clicking the “Search” button.
Step 2: Select at least one data range for Make to return results (learn about supported date formats here)

Step 3: Enter a dimension name you want to include in the module’s output. In our case, we selected the “Browser” dimension.
Step 4: Add metrics you want to include in the importing process. We’ve selected ga:users metric to get the data on the total number of users for the requested time period. If you feel confused about GA dimensions and metrics, take a look at this guide to get a better understanding.
That would be it for connecting Make and Google Analytics. To make sure everything runs smoothly click “Run Once” to test the scenario.
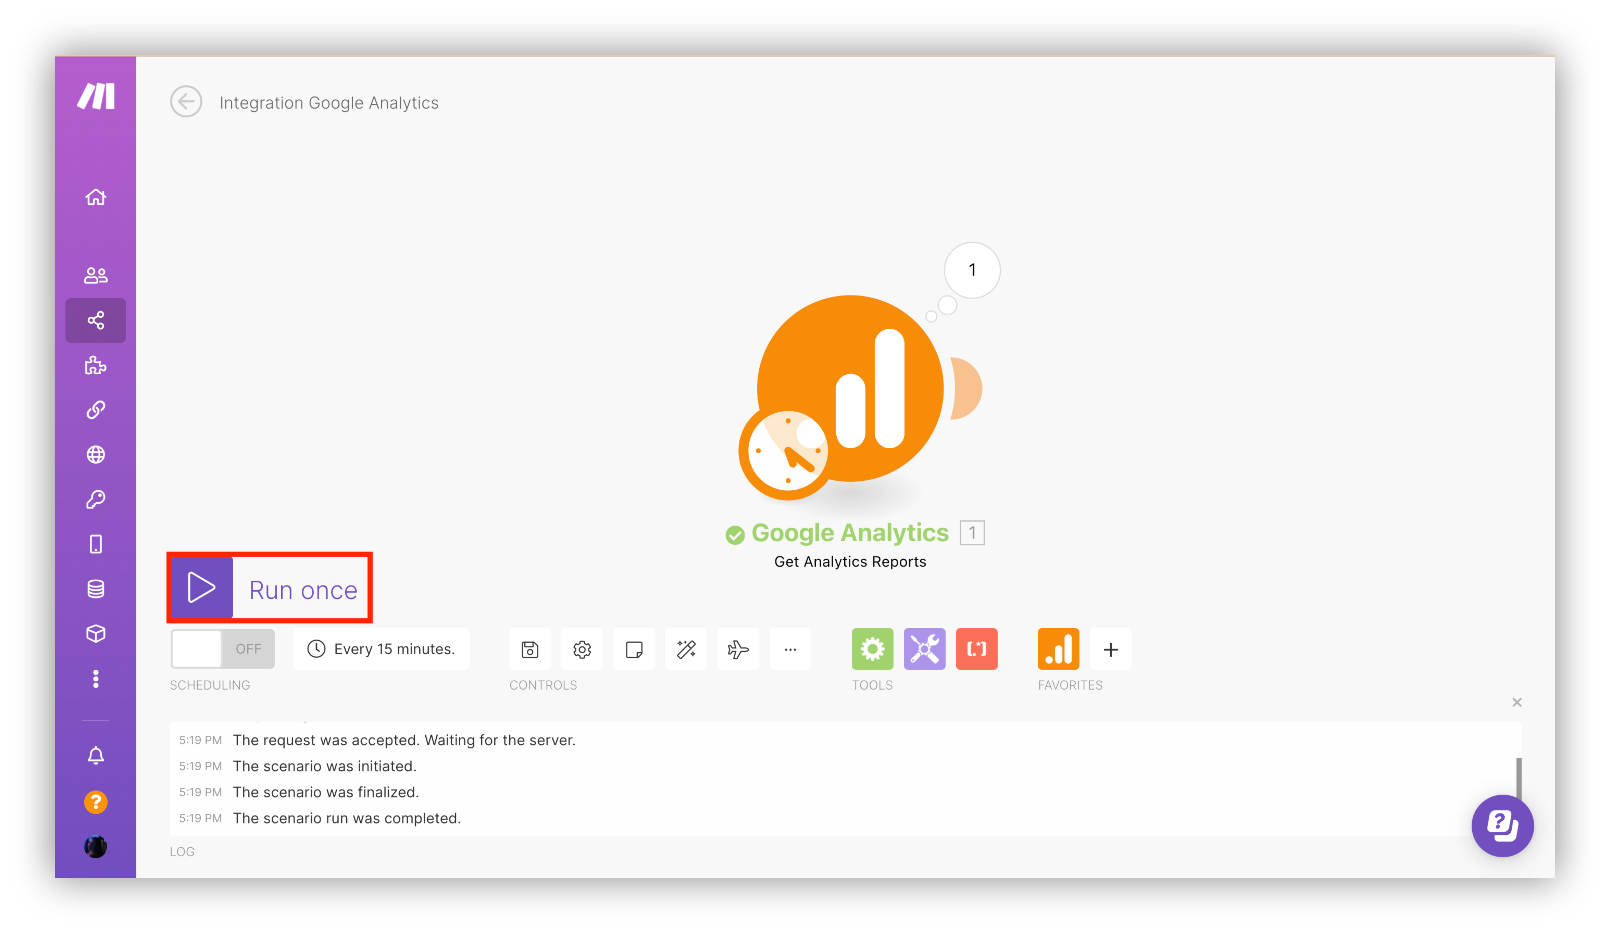
The next stage of the syncing process is connecting Airtable to Make.
Step 1: Click on the + button on the right corner of the Google Analytics module.
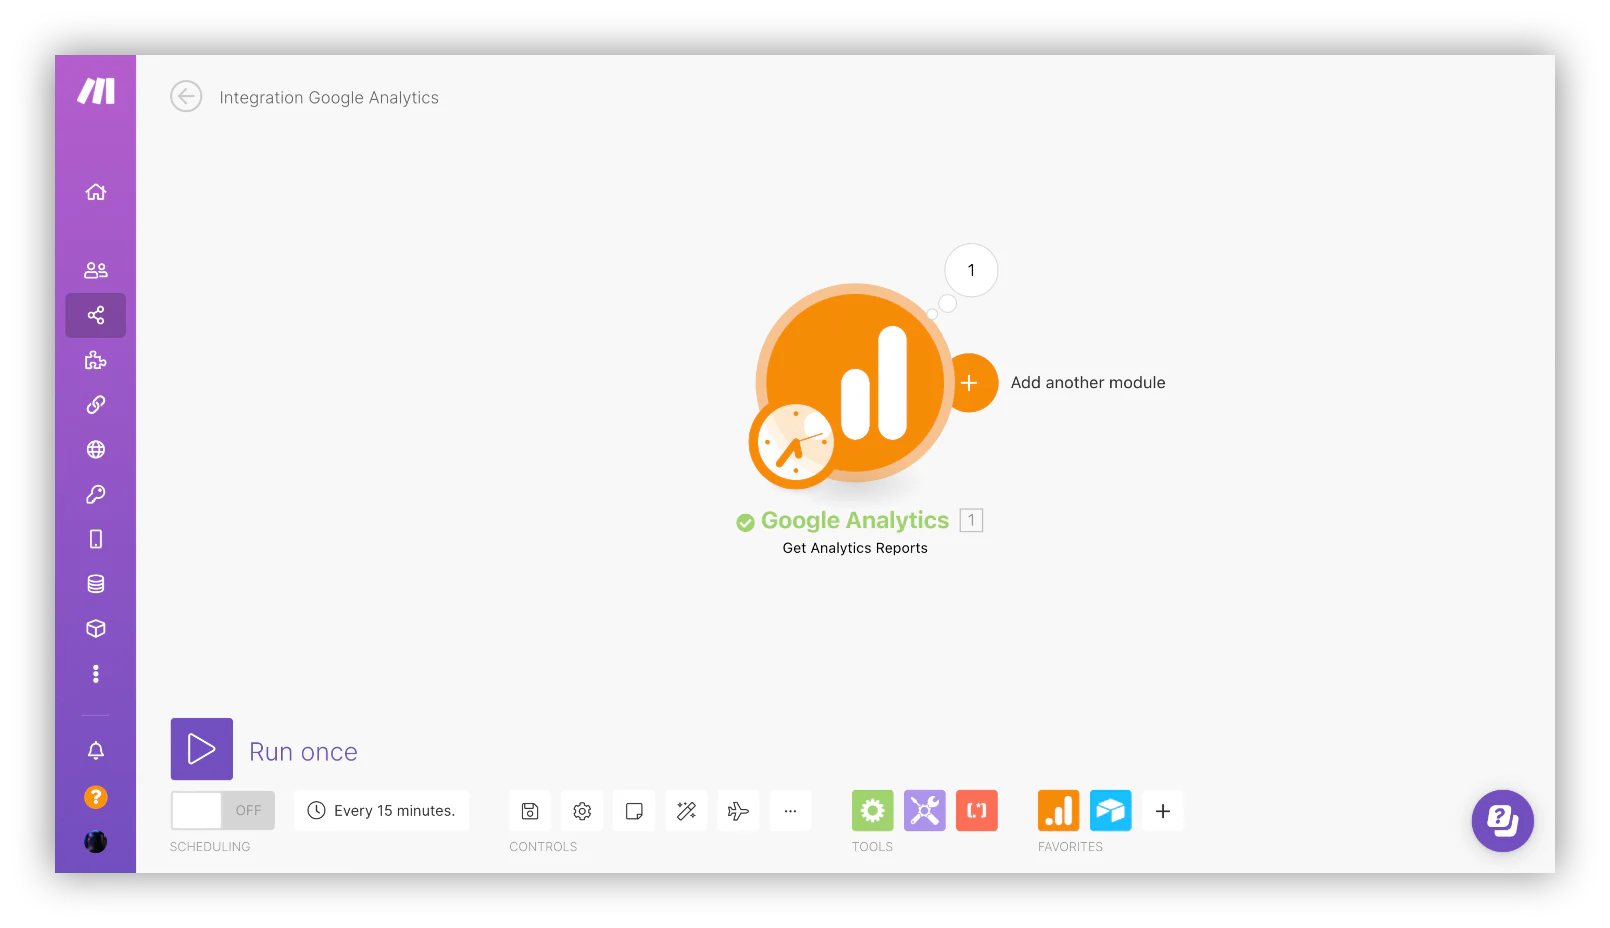
Step 2: From the opened window, we need to find Airtable and select the right action.
We will need to select the “Create a new record” trigger, to have the Google Analytics data be imported to the table automatically.
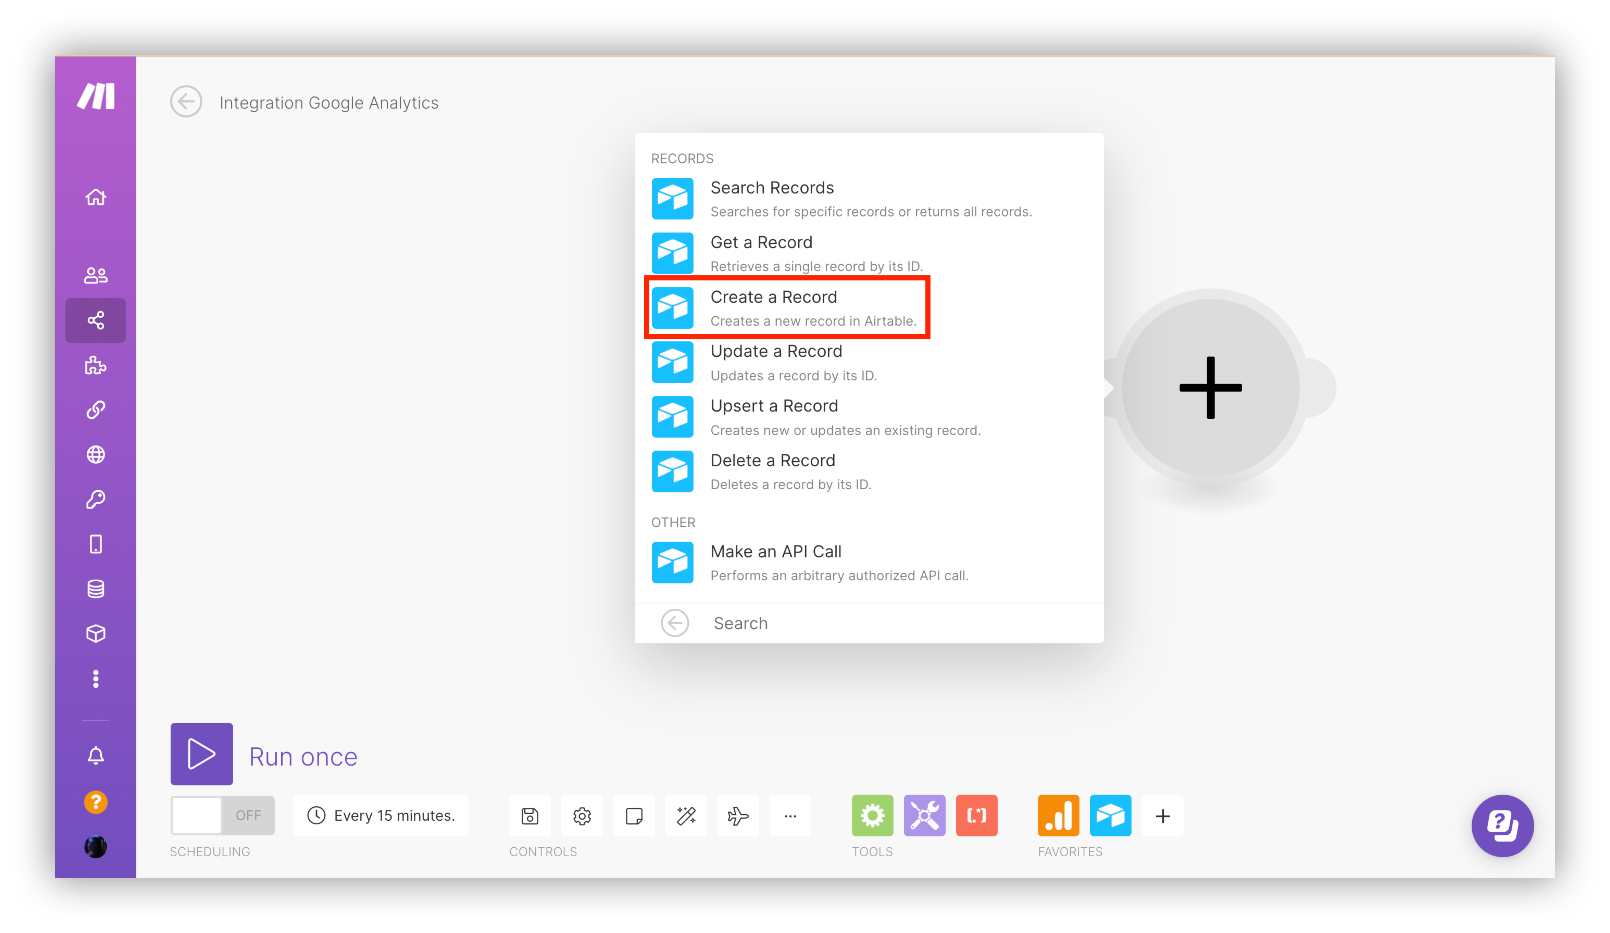
Step 3: Add an Airtable account. Simply click “Add” and fill in your Airtable API key.
Step 4: Select a Base and a Table to create new records.
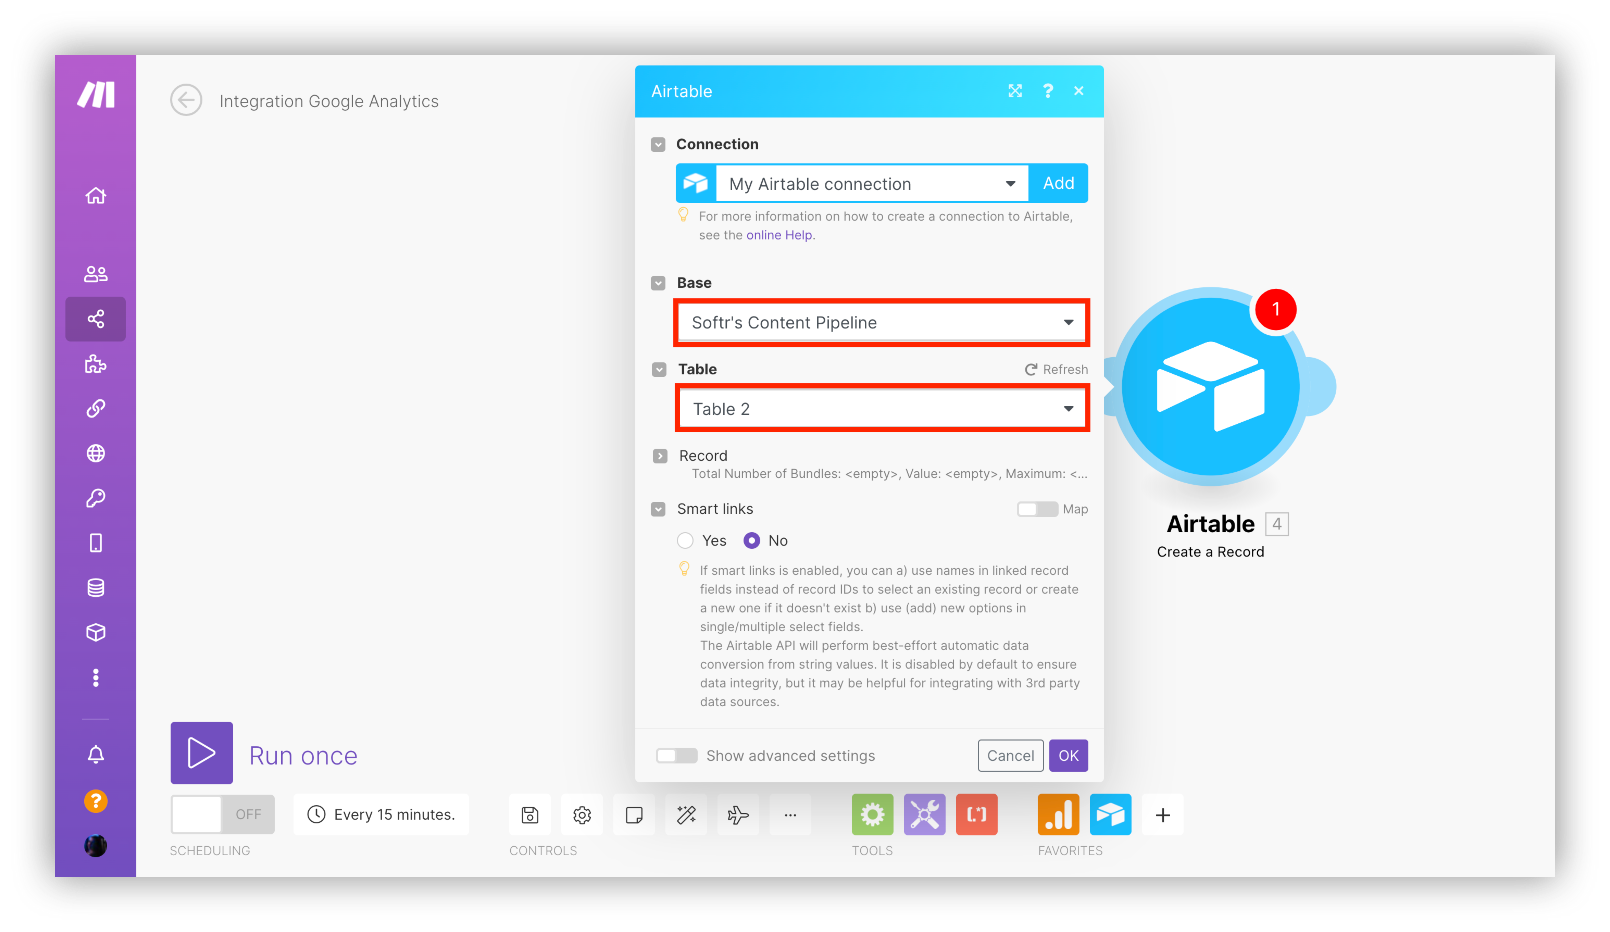
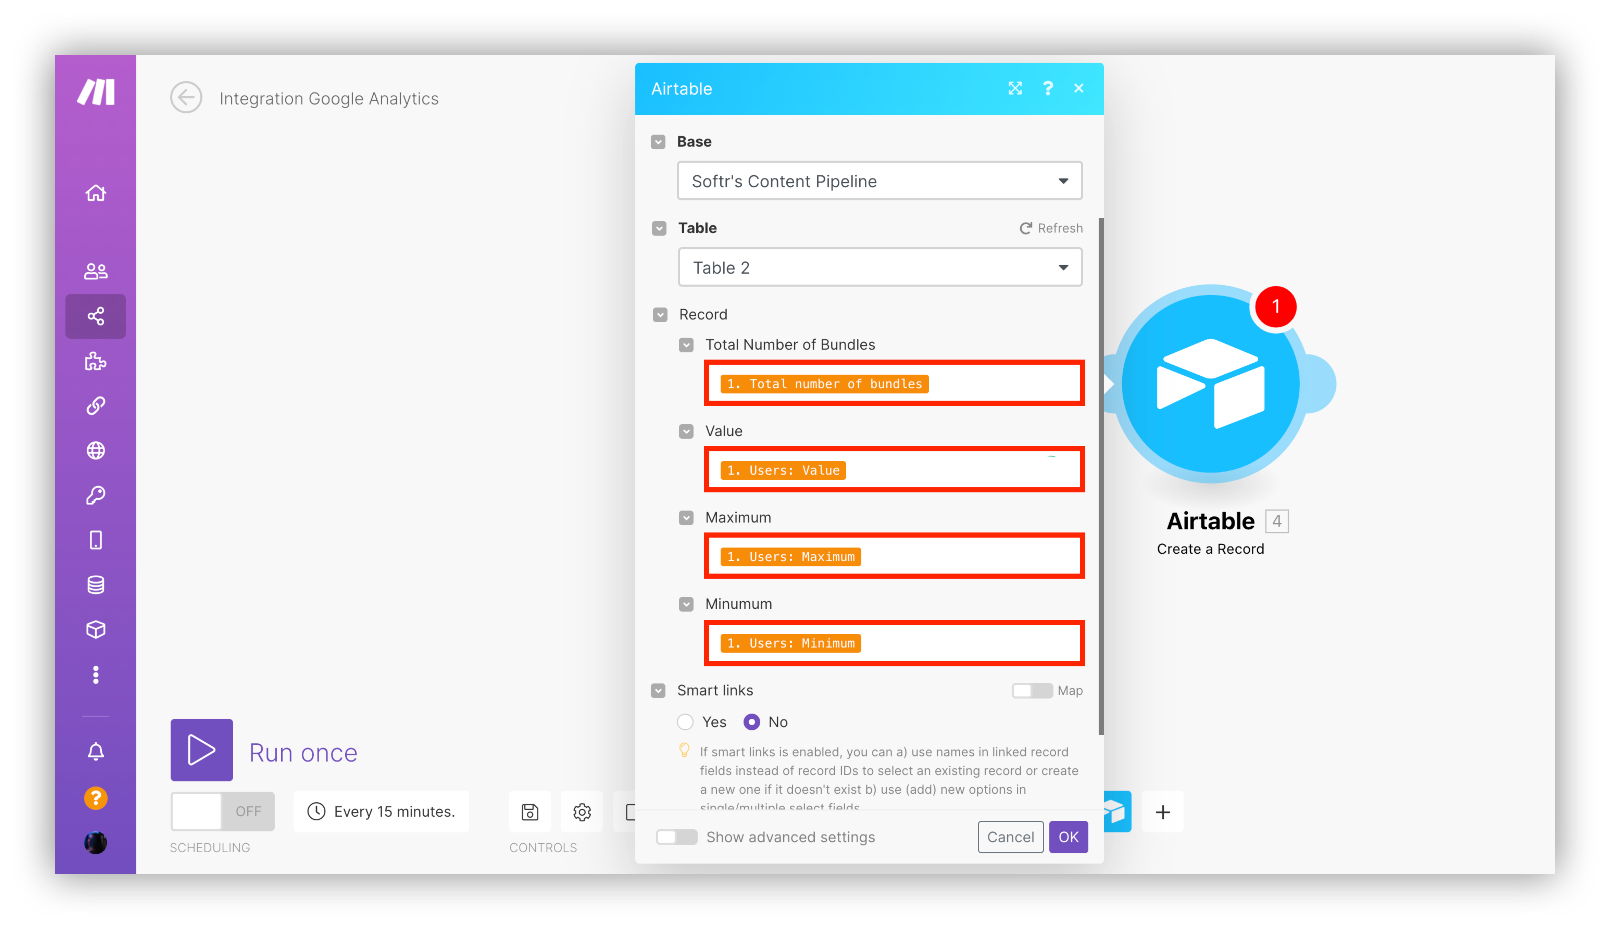
Step 5: Select records to import your Google Analytics data in.
We chose to import The total number of bundles, Users Value, Maximum number of users and Minimum number of users.
Step 6: Run your scenario to make sure you have your data imported to Airtable records successfully.
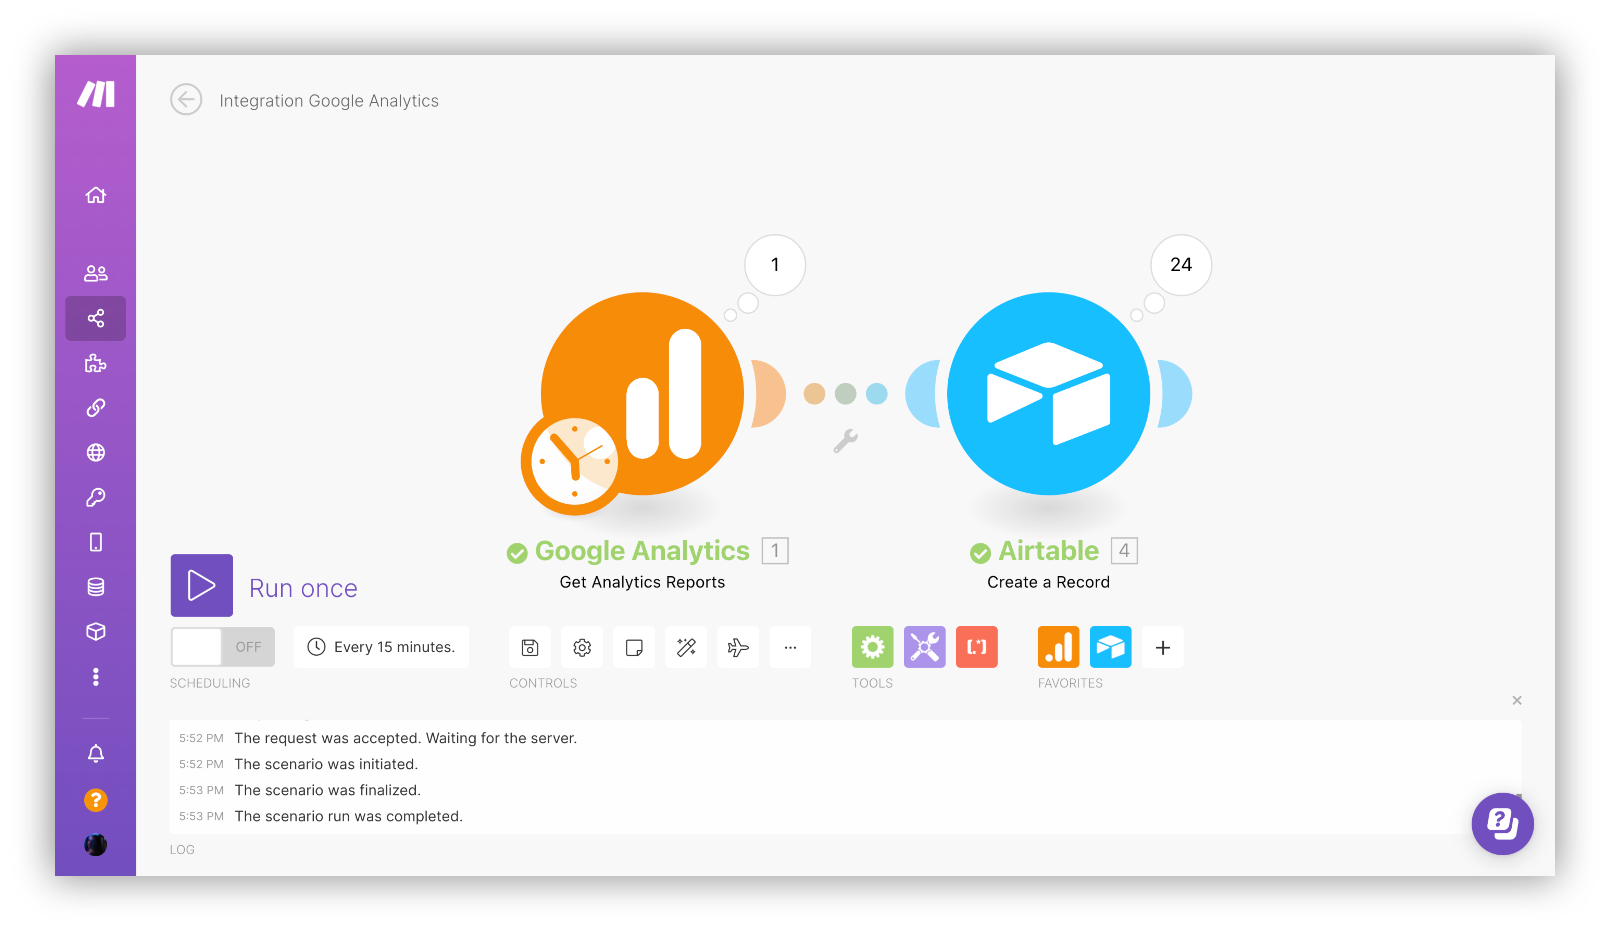
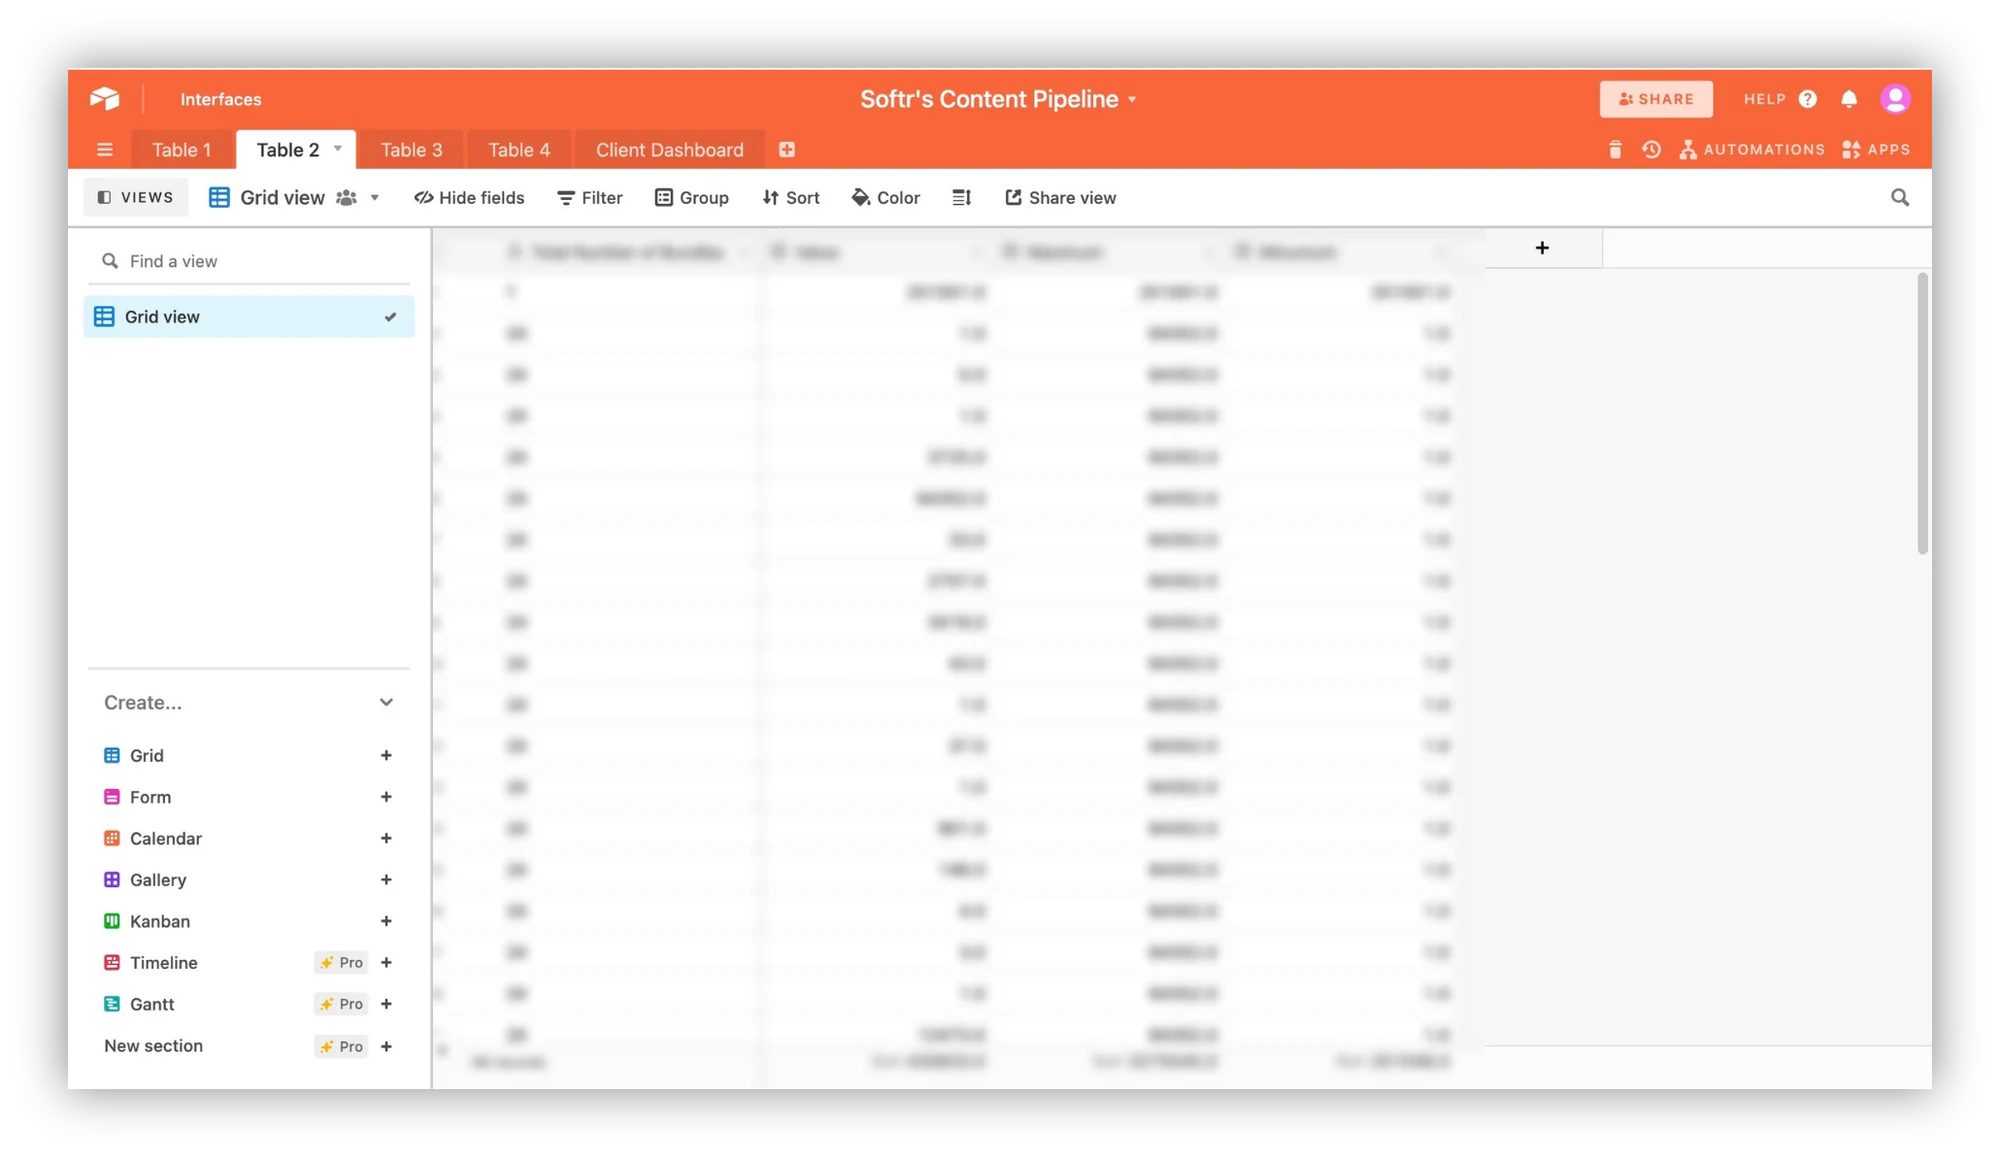
Tada! Now you have your Analytics reports successfully imported to the Airtable table.
Bonus: syncing with Parabola
There is one more no-code automation tool worth knowing about. Parabola also lets you sync Google Analytics and Airtable using visual data pipelines. Here is a step-by-step video that walks through the Google Analytics, Airtable, and Parabola setup in about 30 minutes.
Turn that analytics data into a real dashboard with Softr
Importing the data is the easy part. The harder question is what you do with it. A grid full of sessions and users in Airtable does not help your marketing lead, your client, or your CEO make a decision. They need a clear view: traffic over time, top sources, week-over-week changes, all in one place.
This is where Softr comes in. Softr is a no-code platform with three parts that work together: an interface builder for your pages, native Softr Databases for storing data, and Softr Workflows for automation. You can build on top of your Airtable base, or connect any of 21+ data sources (Google Sheets, HubSpot, a REST API, or Softr's own native database). For analytics reporting specifically, you point Softr at the Airtable table you just filled and add charts and KPI cards on top.
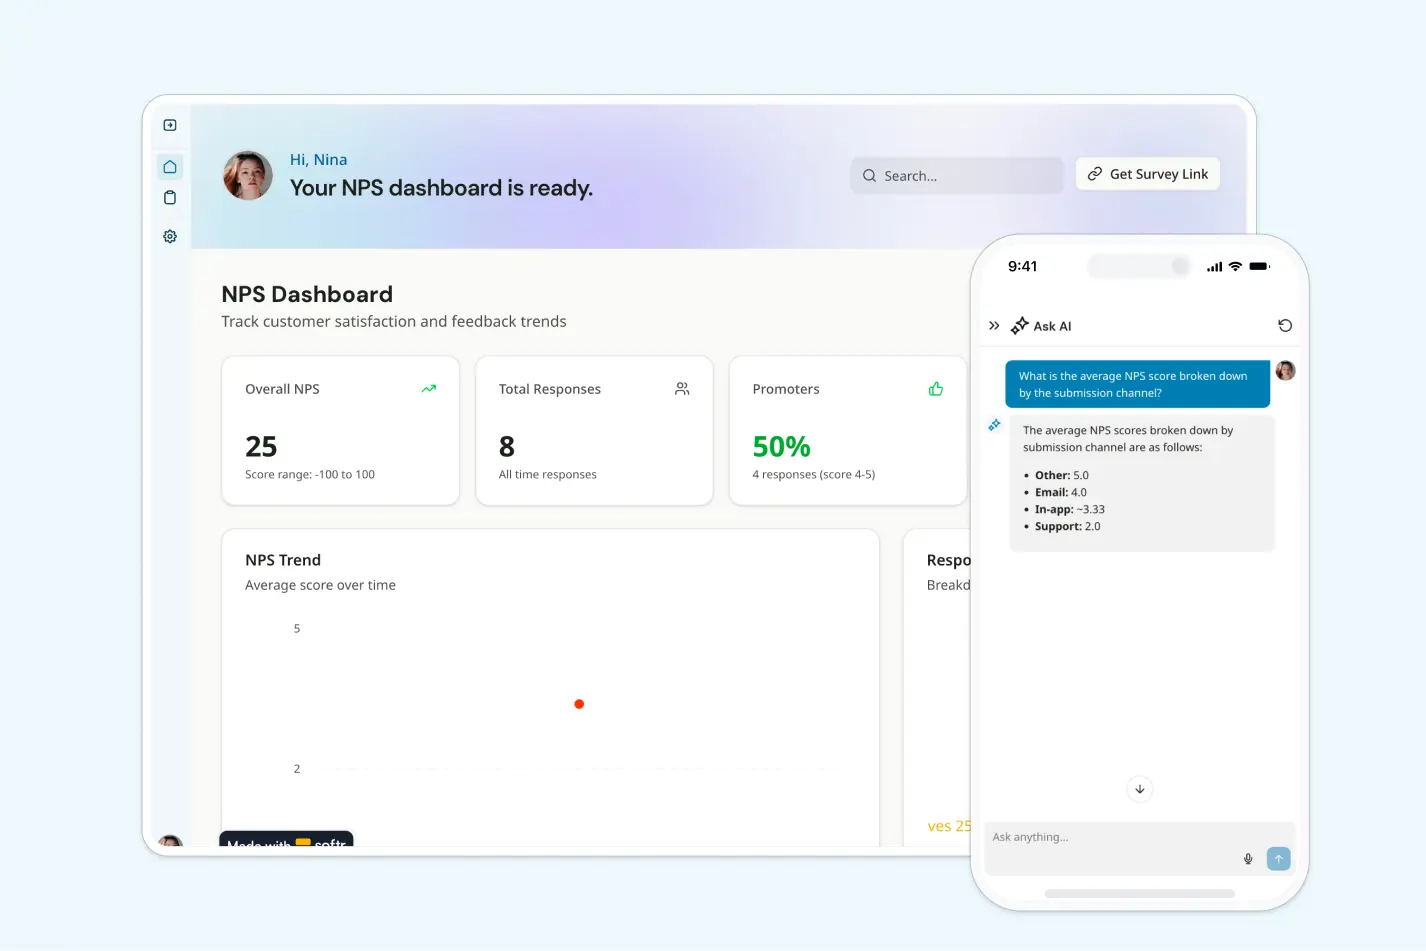
You do not have to build it block by block either. Describe the dashboard you want and the AI Co-Builder generates the pages, charts, and structure for you, or start from a template and adjust. As Mariam Hakobyan, Softr's CEO, puts it:
"If you use the AI Co-Builder to generate the database, you can trust that you are in the top 10% of database design already." - Mariam Hakobyan, CEO and Co-founder of Softr

Softr also lets you control exactly who sees what with users and permissions, so a client sees only their own numbers while your internal team sees everything. And instead of relying on an external tool to keep data fresh, you can build a native workflow that refreshes records or notifies your team in Slack when a metric crosses a threshold.
This is the same pattern teams use in production. The marketing agency Strupek, for example, built a client content and reporting dashboard on Softr and Airtable that cut operational costs by 58% and saved 8 to 10 hours a week on managing systems and generating reports.
If you want to go deeper on the reporting layer, see our guides on Airtable dashboards and the best no-code dashboard builders.
Start building your analytics dashboard
You now have four reliable ways to get Google Analytics data into Airtable, and a clear next step once it lands there. Pick the import method that fits your comfort level, then put a real dashboard in front of it so the numbers actually drive decisions. The fastest way to start is to grab the SaaS Dashboard template and connect it to your Airtable base.
Frequently asked questions
Can I import Google Analytics data into Airtable for free?
What is the easiest way to automate the Google Analytics to Airtable import?
How do I turn imported Google Analytics data into a dashboard?
Do I have to use Airtable, or can Softr connect to other data sources?
Can I control who sees the analytics dashboard?