
[.blog-callout]
TL;DR
- Airtable's Interface Designer lets you turn any base into a dashboard with charts, KPI cards, and tables, for free, with no coding.
- It works best for internal, single-team use. It has limited design customization and no way to give different external users different permissions.
- For client-facing or multi-permission dashboards, pairing Airtable with Softr adds branded design, granular user permissions, and the option to combine Airtable with other data sources or a native Softr Database.
- This guide covers both approaches step by step, plus real examples from businesses running dashboards in production. [.blog-callout]
Project managers, business owners, and operators managing growing teams all run into the same problem: data scattered across tables, tabs, and spreadsheets, with no easy way to see the big picture. Airtable helps by combining the simplicity of spreadsheets with the structure of a relational database. But raw tables only get you so far. To make decisions quickly, you need dashboards that turn that data into something you can actually read at a glance.
In this guide, I'll walk you through two approaches to creating dashboards with Airtable data:
- Creating dashboards in Airtable, using the platform's built-in Interface Designer. This is a cost-effective option that stays within Airtable's free plan.
- Creating dashboards with Softr and Airtable, integrating Airtable with Softr for more customization, real branding, and granular access permissions when you need to share dashboards with clients, vendors, or specific teams.
By the end of this guide, you'll have everything you need to build a dashboard that fits your use case, no coding required.
What is an Airtable dashboard?
An Airtable dashboard is a visual, interactive interface that turns raw data from your Airtable bases into something you can actually act on. Instead of scrolling through rows and columns, you get a dedicated view showing key metrics, tracked progress, and the context you need to make a decision, all in one place.
You build Airtable dashboards using the Interface Designer, a tool built into every Airtable workspace. It lets you display charts, summary cards, and tables on top of your base data, and customize which metrics show up depending on what matters most to you: project timelines, sales figures, or content calendars, for example.
You don't need technical expertise or coding skills to build one. Whether you start with a pre-built template or an empty base, the Interface Designer walks you through choosing a layout and connecting it to your data.
Airtable's dashboards work well for internal use, but they're intentionally limited when it comes to design flexibility and permissions. If you need to share a dashboard with clients or vendors, control exactly what each group sees, or add custom branding, pairing Airtable with Softr gets you there. Softr connects directly to your Airtable base and adds a dedicated interface layer with the granular permissions and design control Airtable's native tools don't offer.
{{cta-1}}
Benefits of using Airtable dashboards
Airtable dashboards do more than let you view your data. They streamline workflows and speed up decisions by turning static information into visual, interactive insights that are faster to read and easier to act on.
Here are some the main benefits of using Airtable dashboards:
Streamlined data access
With dashboards, everything you need is in one place, so you're not navigating through multiple tables or views. Your key metrics are presented clearly, helping you stay focused on what matters.
Improved team collaboration
Dashboards simplify how teams share and access information. Whether it’s a summary of project progress or real-time sales data, dashboards ensure everyone stays aligned without sifting through raw data.
Real-time updates
Airtable dashboards are dynamic, meaning any changes to your base are instantly reflected. This makes them ideal for tracking evolving data, like deadlines, performance metrics, or budgets.
Flexible and customizable
Whether you’re building a project tracker, sales report, or content calendar, Airtable dashboards can be tailored to suit your specific needs. Choose the elements, layouts, and filters that best present your data.
Accessible to everyone
You don’t need technical expertise to create or use an Airtable dashboard. The interface is designed for simplicity, making it easy for anyone to build and customize dashboards.
Together, these benefits make Airtable dashboards a practical way to simplify complex processes, foster collaboration, and help teams make faster, better-informed decisions.
Use cases for Airtable
Airtable dashboards are designed to adapt to a variety of needs, whether you’re running a business, managing a team, or overseeing personal projects. Broadly, their use cases fall into two main categories:
Reporting
- Dashboards are invaluable for tracking progress over time and presenting it in a way that’s easy to understand. This is especially useful when communicating with stakeholders or executives.
- As an example, a reporting dashboard might track progress toward quarterly goals, highlighting milestones reached and projects falling behind. This type of dashboard provides a clear, actionable summary of your data.
Monitoring
- When you need to keep a finger on the pulse of your operations, dashboards can help you understand the current state of things and spot any unexpected issues.
- One example is that monitoring dashboard could focus on capacity planning, showing how your team members’ time is allocated over the next two weeks. This helps you identify potential bottlenecks or areas of overcommitment at a glance.
While these high-level categories cover the primary purposes of dashboards, their flexibility allows them to address nearly any scenario where visualizing data can help. Whether you’re tracking sales pipelines, managing editorial calendars, or analyzing product performance, there’s a dashboard for that.
How Airtable dashboards work
At the heart of every dashboard is an Airtable base, your centralized hub for data. Whether you're tracking projects, analyzing sales, or managing a calendar, your base provides the foundation. Once your data is set up, the Interface Designer lets you select a layout, such as the "Dashboard" option, designed for visualizing key metrics at a glance.
After choosing a layout, the next step is linking your dashboard to the relevant table in your base. This connection ensures the right data flows into your dashboard, ready for customization. You then add elements like charts, summaries, tables, and filters to bring your data to life. Each element is customizable, giving you control over how information is displayed, from the color of a chart to the specific records shown.
Airtable dashboards update in real time: as data in your base changes, your dashboard reflects it instantly, so you're always working with the latest information. That's genuinely useful for internal reporting. Where Airtable's dashboard tools fall short is control over who sees what. There's no way to build a dashboard that shows a client only their own project, or a vendor only their own invoices, without giving them full access to your base. That's the gap Softr fills, which we'll cover in the second half of this guide.
Creating dashboards in Airtable
Before you can create a dashboard in Airtable, your base (the foundation of your data) needs to be structured properly. Whether you're starting from scratch or using a template, organizing your base is key to building a dashboard that delivers clear and actionable insights.
If your data is already organized in an Airtable base, skip ahead to Step 2.
Step 1: Prepare your base or use a template
Before diving into dashboard creation, make sure your Airtable base is well-structured. Whether you're building your base from scratch or starting with an existing base or template, a well-organized base is key to creating a functional, insightful dashboard.
Step 1.1: Structuring your base
The structure of your base impacts how effectively your data will translate into a dashboard. Keep these points in mind when preparing your base:
- Organize your data into separate tables for distinct datasets. For example, in a project management base, you might create one table for tasks, another for team members, and a third for milestones;
- Link related tables to ensure seamless connections between your data. For instance, linking tasks to team members allows you to track responsibilities effortlessly;
- Use clear and descriptive field names to make dashboard configuration easier later. Instead of generic labels, use names like “Task Status” or “Deadline;”
- Choose the right field types for your data. Airtable offers a variety of field types, like single select, date, checkbox, and attachment, that help structure your data effectively. For example, use a "Single Select" field for status options (e.g., "In Progress," "Completed") or a "Date" field to track deadlines. Picking the right field type makes your data easier to sort, filter, and visualize;
- Create filtered views to focus on the data you need for your dashboard. These views can be grouped, sorted, or filtered to emphasize specific metrics or categories.
Not sure how to design your base? You can explore examples and resources on Airtable databases provided by Softr. These examples are especially helpful for understanding how to structure tables and relationships effectively.
Step 1.2: Starting with a template base
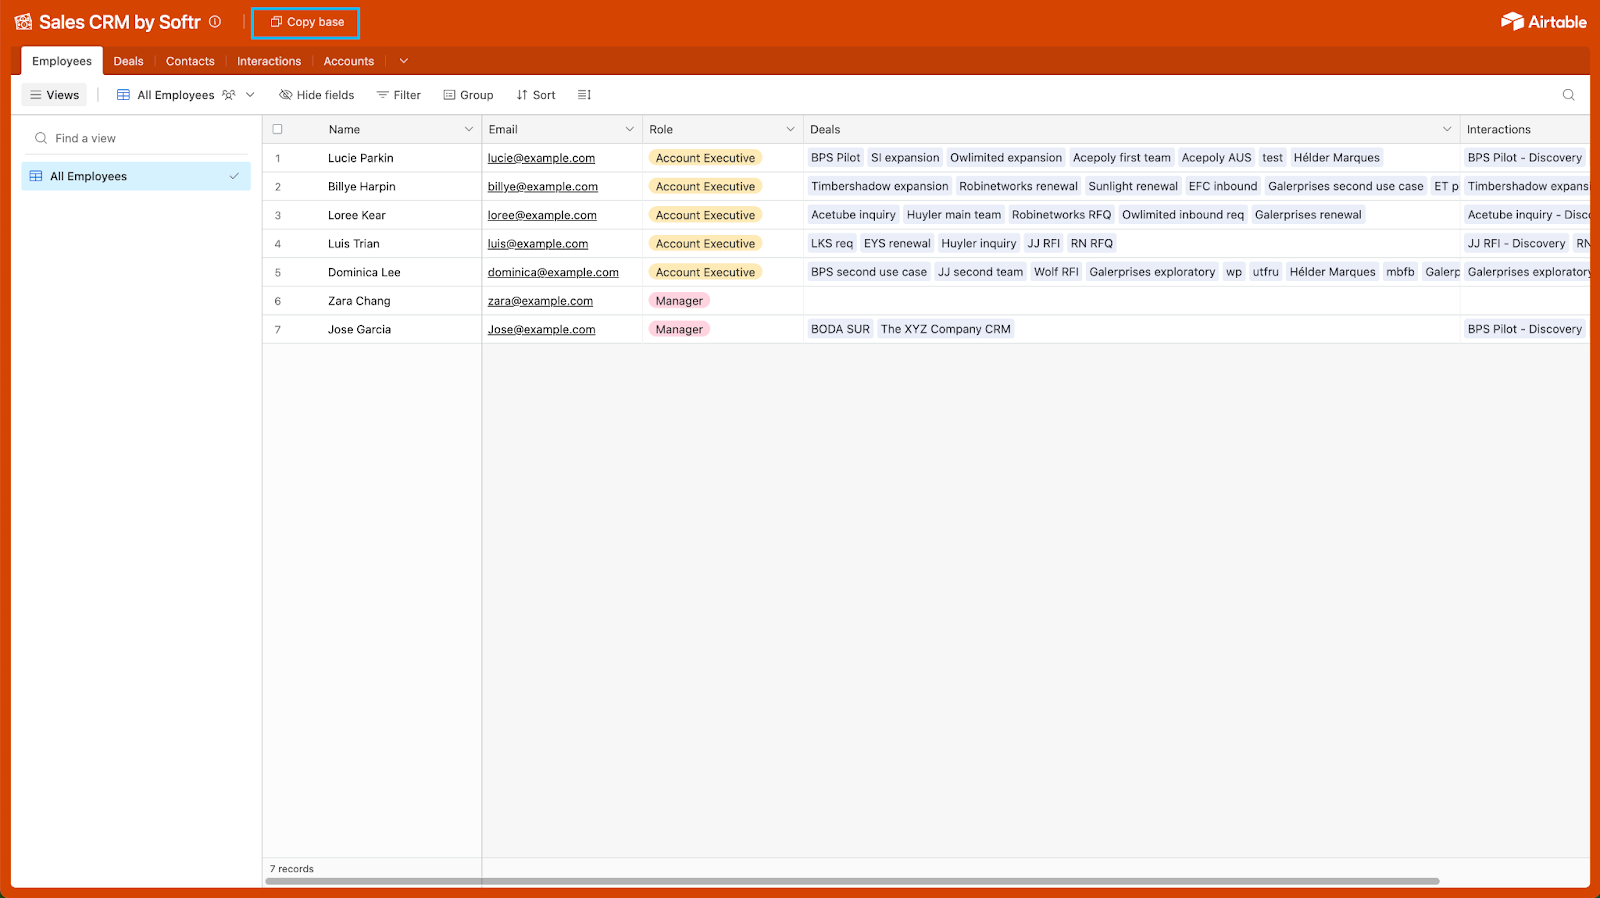
If structuring a base feels overwhelming or you're short on time, using a pre-built template can save you a lot of effort. Airtable offers a variety of templates tailored to different workflows, and for this guide, we'll use the Sales CRM Template, a versatile option for tracking leads, opportunities, and sales performance.
Here’s how to get started:
- Visit the Sales CRM Template page;
- Click “Copy Base” at the top of the page to duplicate the template into your workspace;
- In the pop-up window, select the workspace where you want the base to live, then click “Add Base.”
This template provides a well-structured foundation, complete with linked tables for leads, opportunities, and sales reps. It also includes example records and pre-configured fields like “Lead Status” and “Estimated Value,” which you can customize to suit your specific needs. Once the base is added to your workspace, you’re ready to move on to building your dashboard in Airtable’s Interface Designer.
Step 2: Go to “Interfaces”
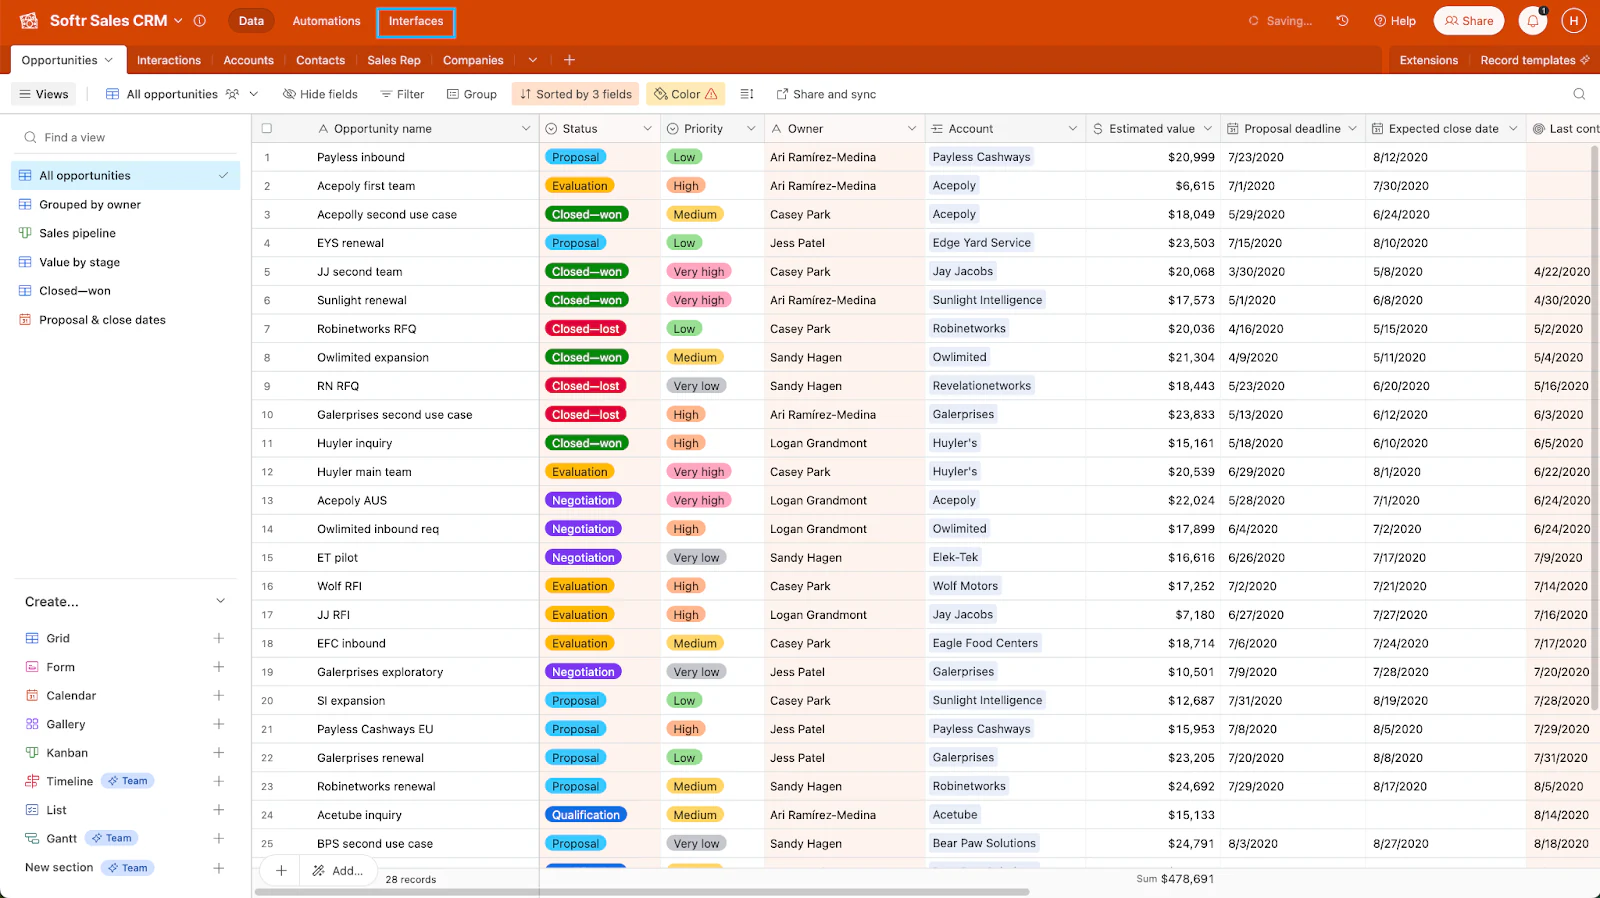
On the top of the page, next to the base name, you will have three options: “Data,” “Automations,” and “Interfaces.” Click on the latter.
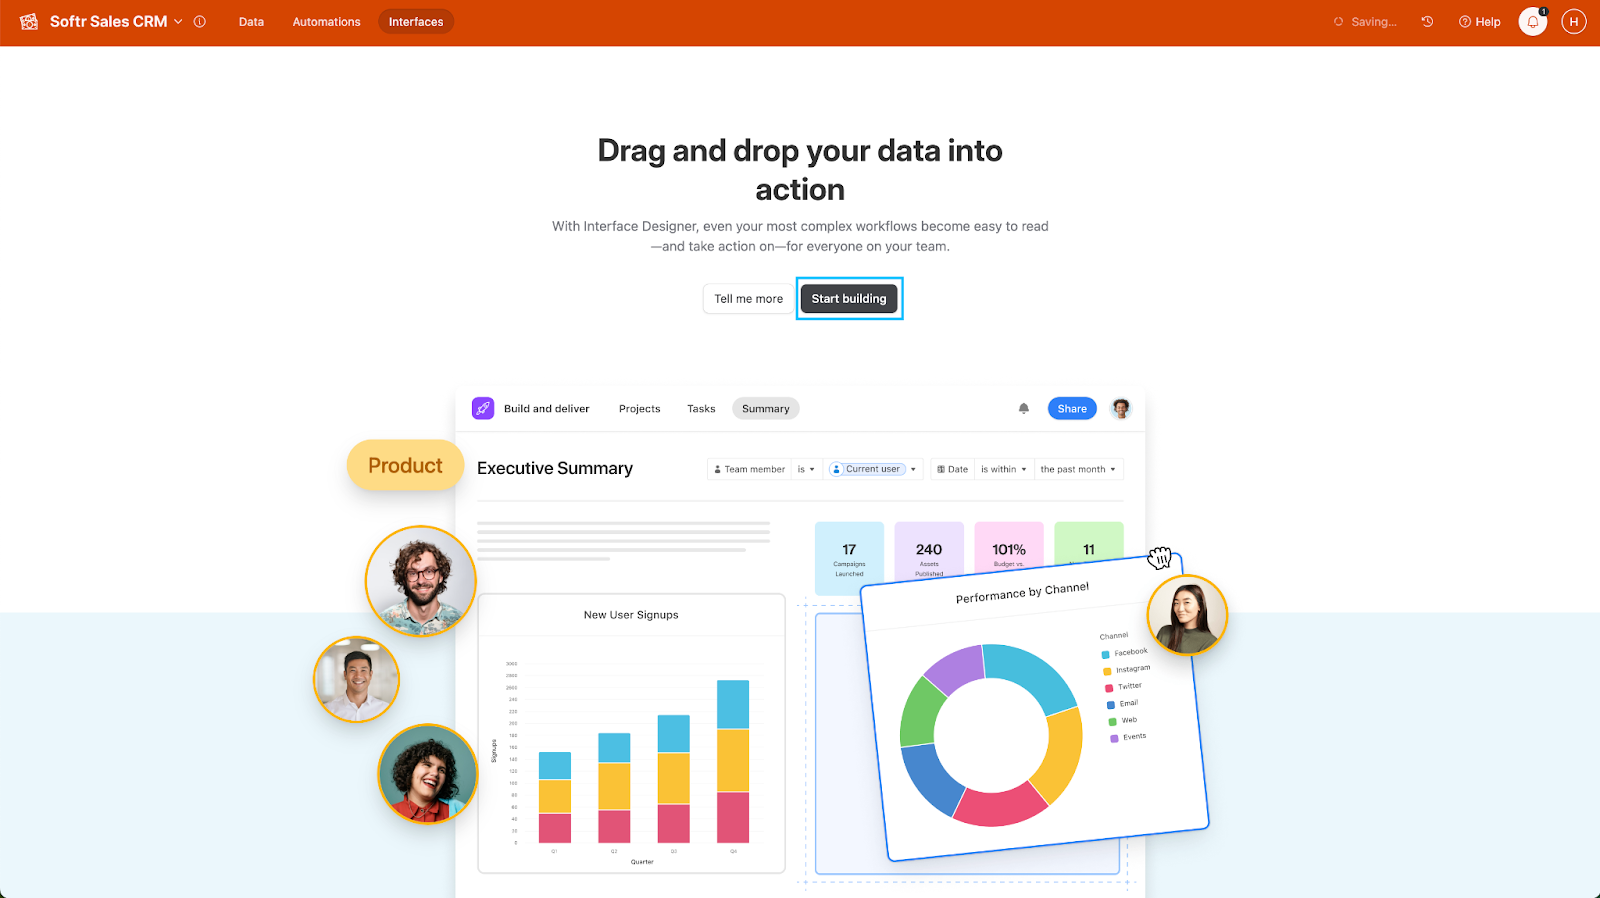
Step 3: Create a new interface
As we are building our first interface page, an informative page will appear. There, you should click on “Start building” to start creating your dashboard.
After that, click on “Build an Interface”. An informative popup with more information about interfaces may appear, you should read it and click to continue.
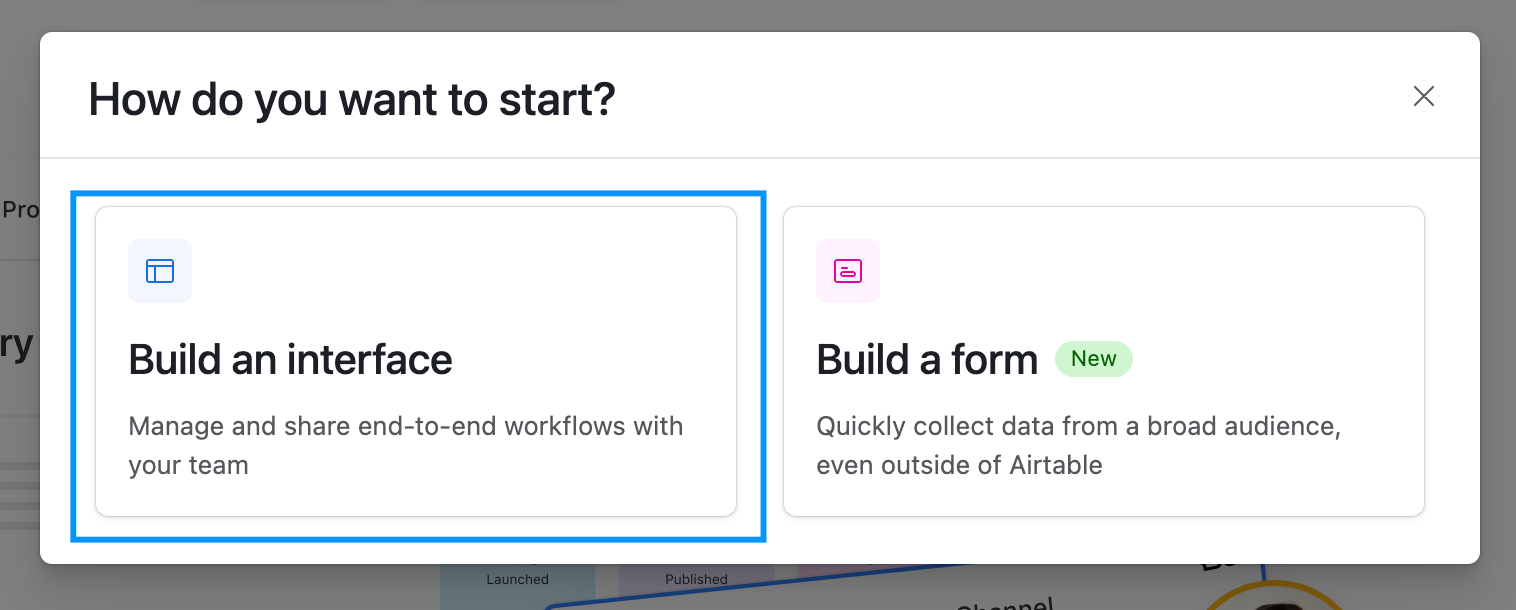
Step 4: Create your dashboard
Now that you have a database and accessed Airtable Interface Designer, follow the next steps to create a dashboard.
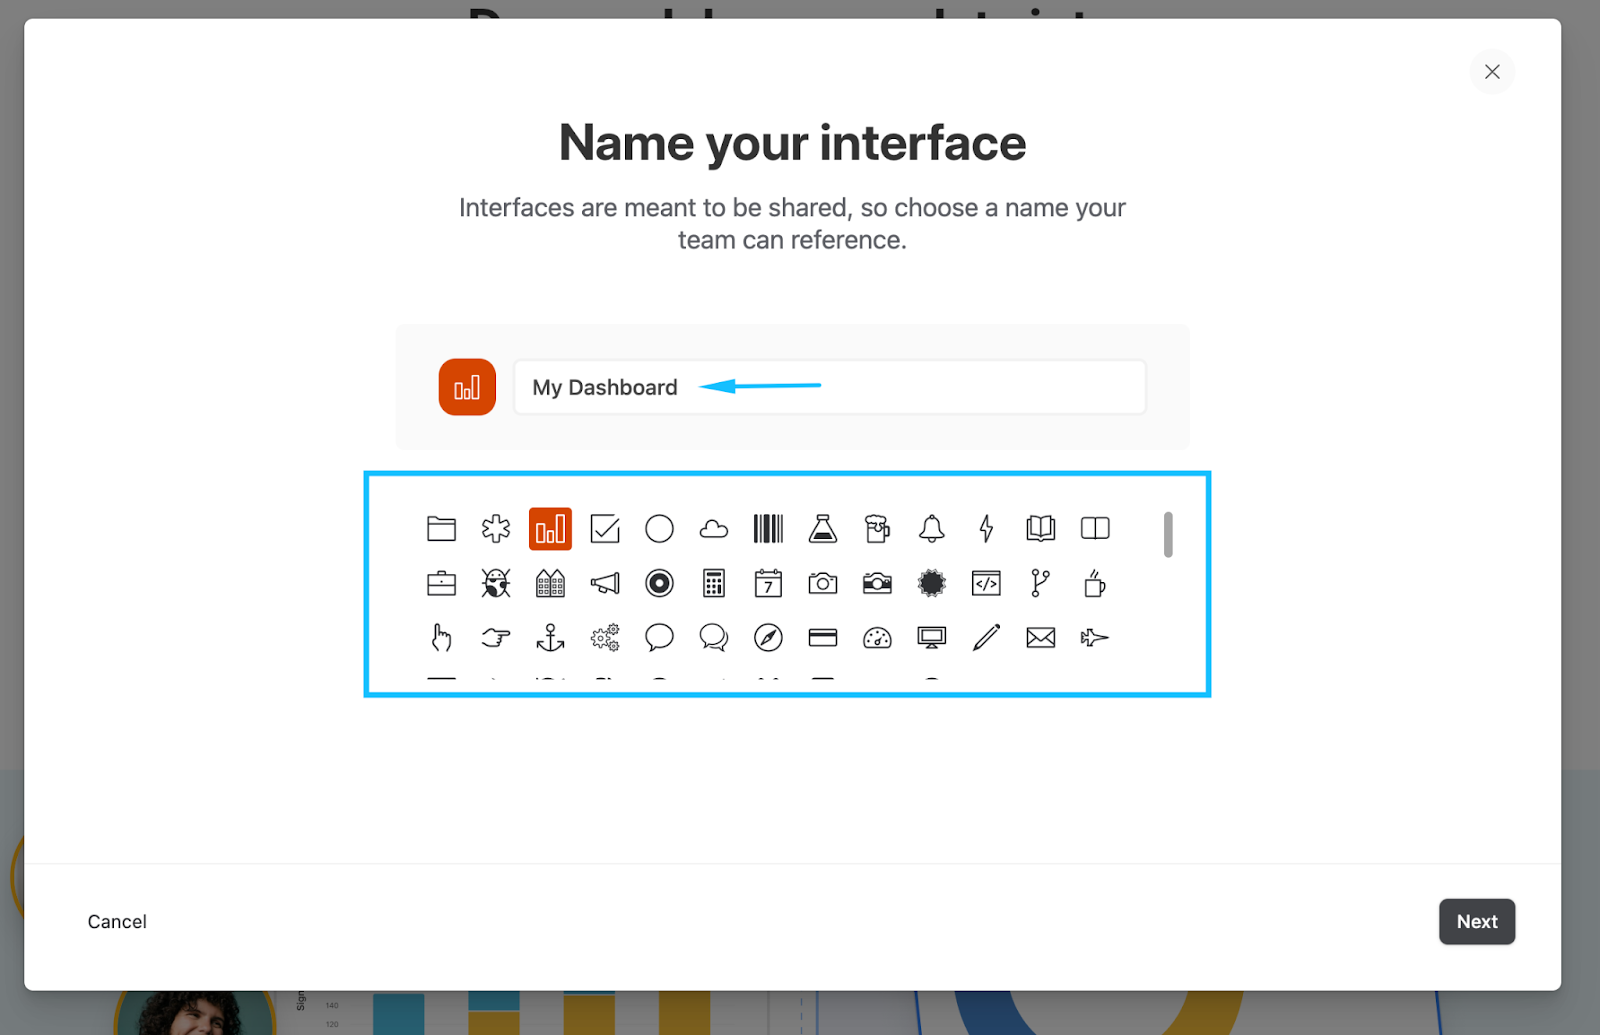
Step 4.1: Name your dashboard
Airtable will prompt a popup for you to choose a name and an icon for your interface, which will be your dashboard. In this guide, I’ll name it “My Dashboard.” You may choose the icon that you like.
Step 4.2: Choose a layout
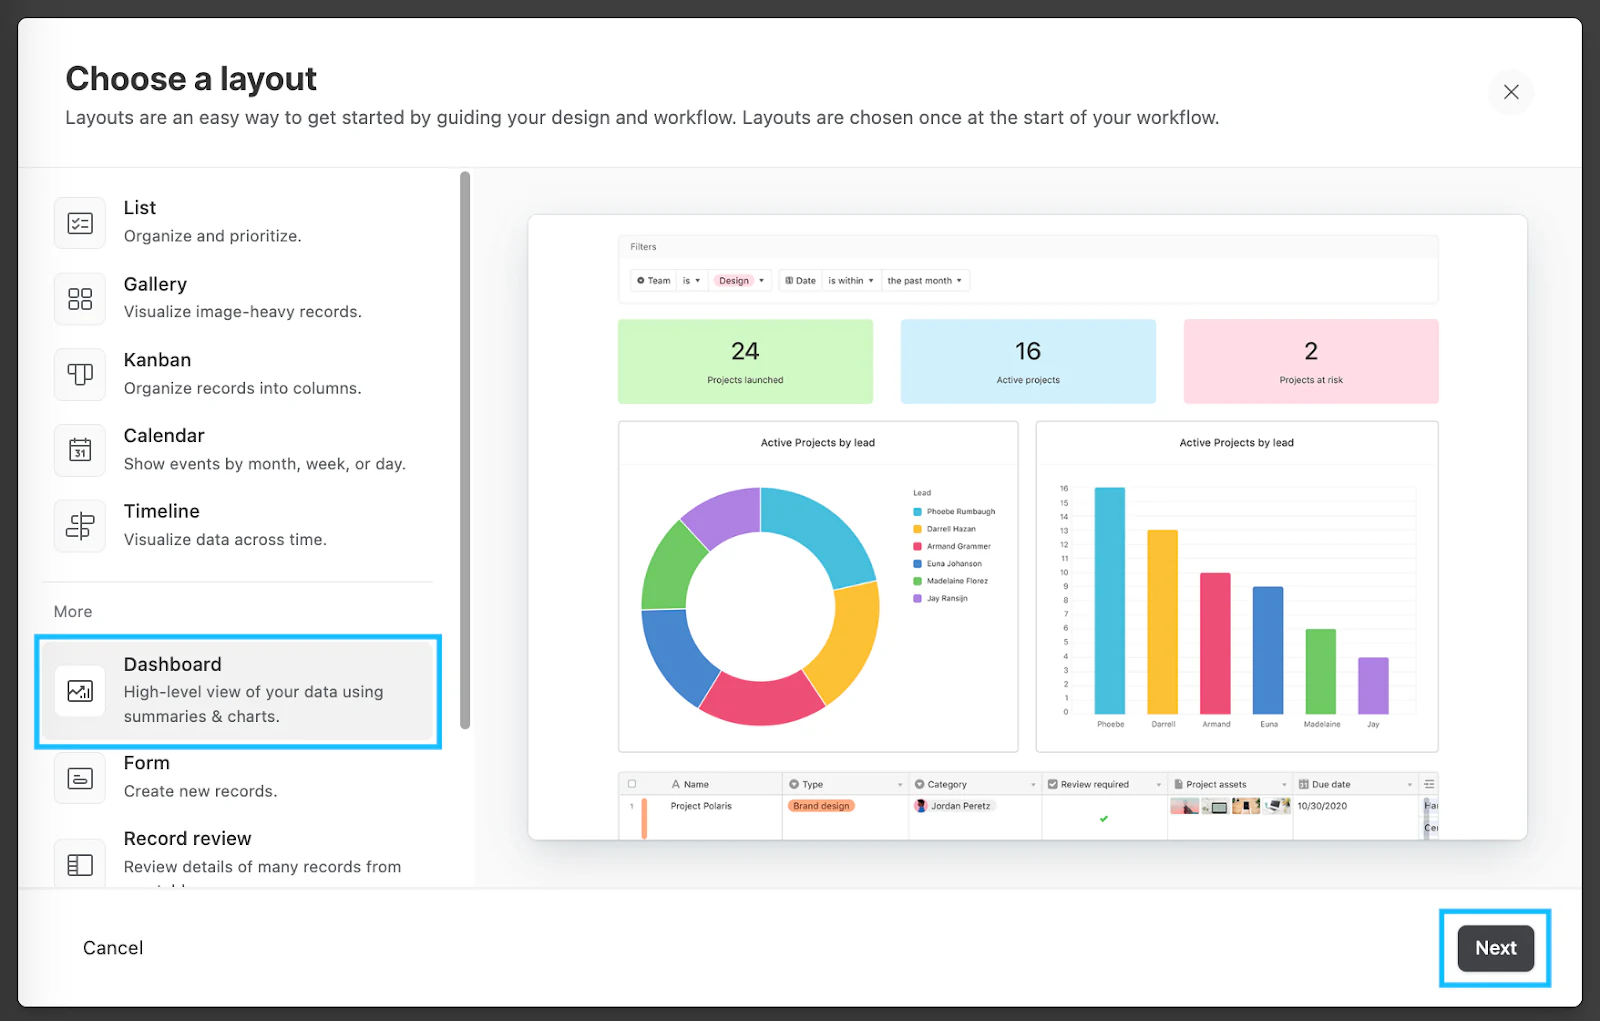
Airtable has a comprehensive list of pre-built layouts with corresponding blocks to summarize and aggregate your Airtable data. Depending on what you want to display you may choose different options, such as “Kanban,” “Timeline,” “Dashboard,” or “Record review.”
Because you want to create a dashboard, choose the Dashboard layout and click on “Next.”
Step 4.3: Connect to a table
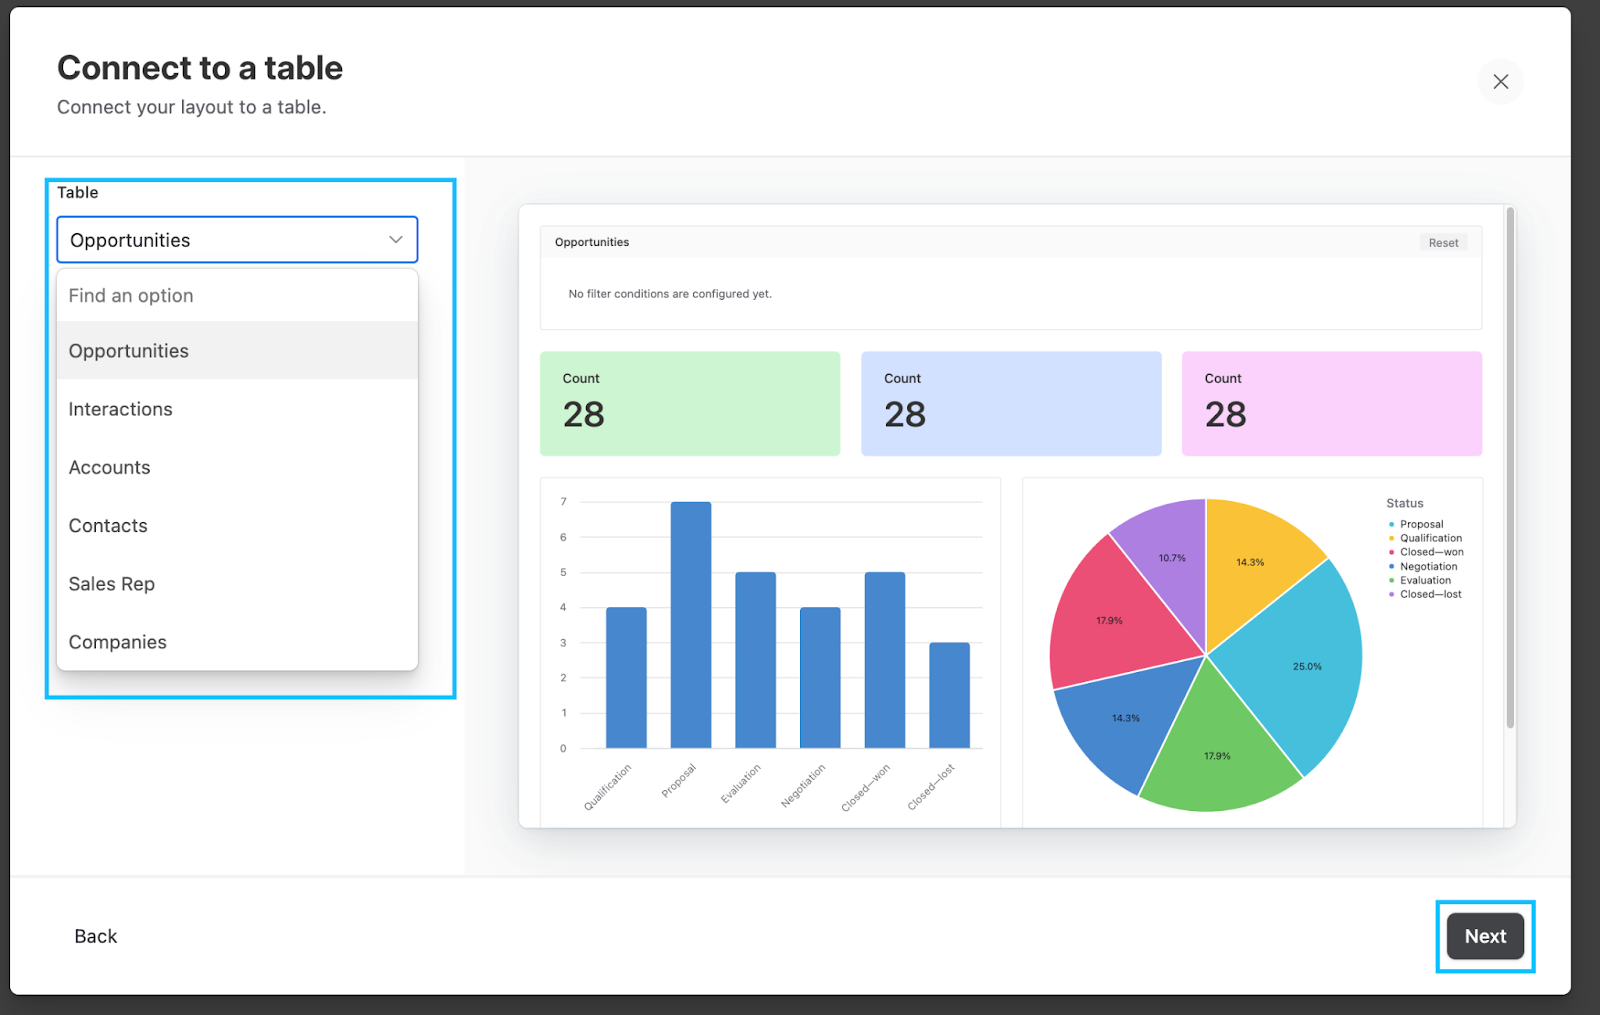
You are almost done with this initial set up. Just choose the table where your data is and click “Next.”
Step 4.4: Complete the initial configuration
The last steps in creating a dashboard are adding and editing elements to its first page and naming it. I strongly recommend you to skip the first of these steps because you will have more options to edit these elements later.
You just need to click “Next,” name your dashboard page and click on “Finish.”
Whether you need to add more elements or edit the ones provided from the chosen layout, follow the instructions on step 4 and step 5, respectively.
Step 5: Add elements
To add a new element to your dashboard, click on the “+ Add element” button on the bottom-left side of the window, choose the element you want to add and place it on the place you want it to be.
Step 6: Personalize your dashboard’s elements
Once you click on an element, the sidebar on the right will provide you with options to define the data settings and the appearance of that specific element. Here are some examples of how you can personalize the elements in your dashboard.
Step 6.1: Add filters
The top element on your dashboard functions as a filter. This filter allows you to select the data that will be used by all other elements on your dashboard. In other words, the other elements will aggregate and calculate data based on the filtered criteria you set.
After clicking on this element find the option “Filter,” under the section “Data” on the right-side bar. Once you click on it, you can define what conditions you want.
Step 6.2: Change elements’ appearance
You can easily change colors, titles and descriptions of your dashboard’s elements, by clicking on the “Appearance” tab on the right sidebar.
Step 6.3: Filter the data used by your dashboard’s elements
On the “Data” tab, you can choose to either include all records from your table or specify which records to include by setting conditions. Click on “Specific records” in the “Records” section, and configure the conditions that are relevant to the element you are editing.
Step 6.4: Change fields and values used by your dashboard’s elements
Depending on the element you are using, you may find a variety of options related to fields, values, axis or data. Explore these options according to the elements you are using in your dashboard.
In my example, I edited a pie chart to display the sum of the estimated value of each opportunity status. The video below illustrates how you can change the category used and the value considered for each slice of the chart.
Step 7: Publish and share your dashboard
Once you have finished personalizing your dashboard, you are ready to publish it and, eventually, share it with your team or stakeholders.
On the top-right of the window, click on “Publish” and confirm this action on the popup.

Creating dashboards with Softr and Airtable
Softr takes dashboard creation further by adding a dedicated interface layer on top of your Airtable base, with real design customization, granular user permissions, and a polished, branded look. This matters most when your dashboard needs to go beyond your internal team: sharing progress with a client, giving vendors a view into their own tasks, or publishing a portal that looks like part of your product rather than a spreadsheet export.
The fastest way to get started is to describe what you need to Softr's AI Co-Builder, which generates a working dashboard (pages, blocks, and data connections) in minutes. If you'd rather see the manual process first, or want more control from the start, follow the template-based walkthrough below.
Step 1: Sign in or register to Softr
First, you will need to log in to Softr. If you don’t have an account, you can sign up to Softr for free.

Step 2: Click on “New Application”
With your Softr account set up, it's time to create a new application where your dashboard will be housed.
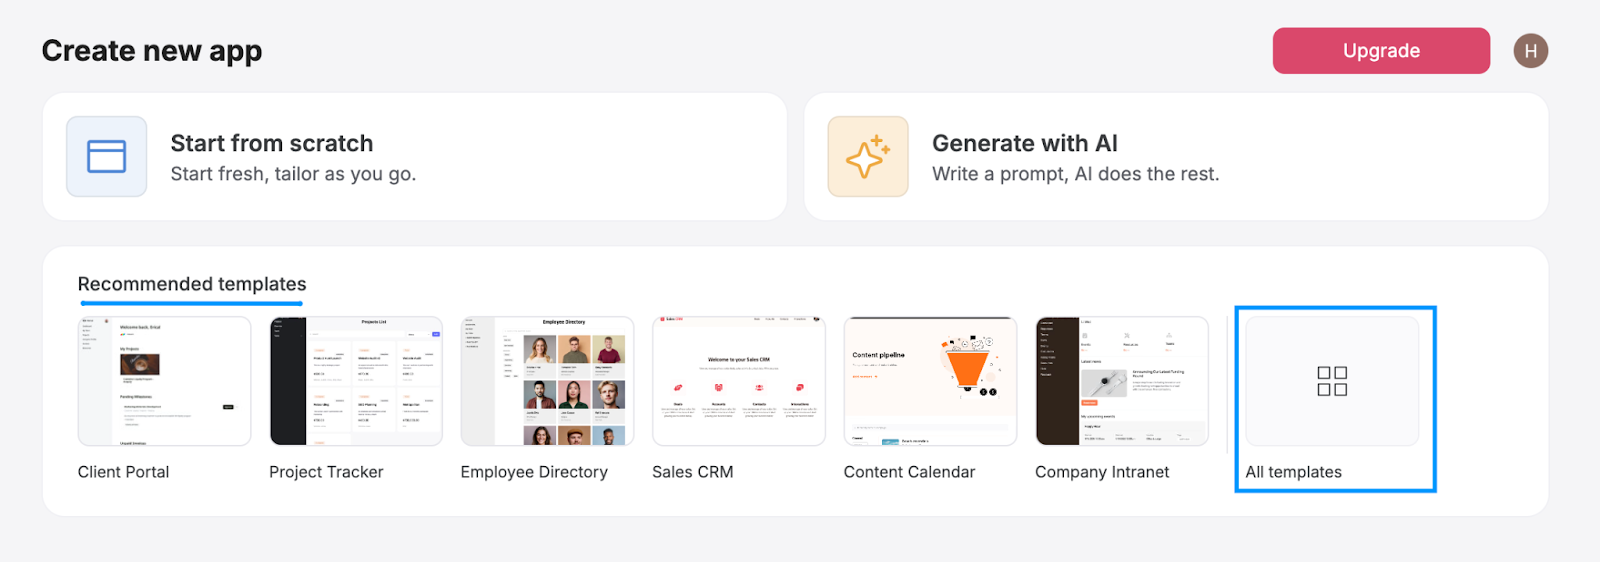
On your Softr dashboard, at the top of the page you’ll see a “Create new app” section. Under “Recommended templates”, locate and click on the "All templates" button.
Step 3: Search for a adequate template
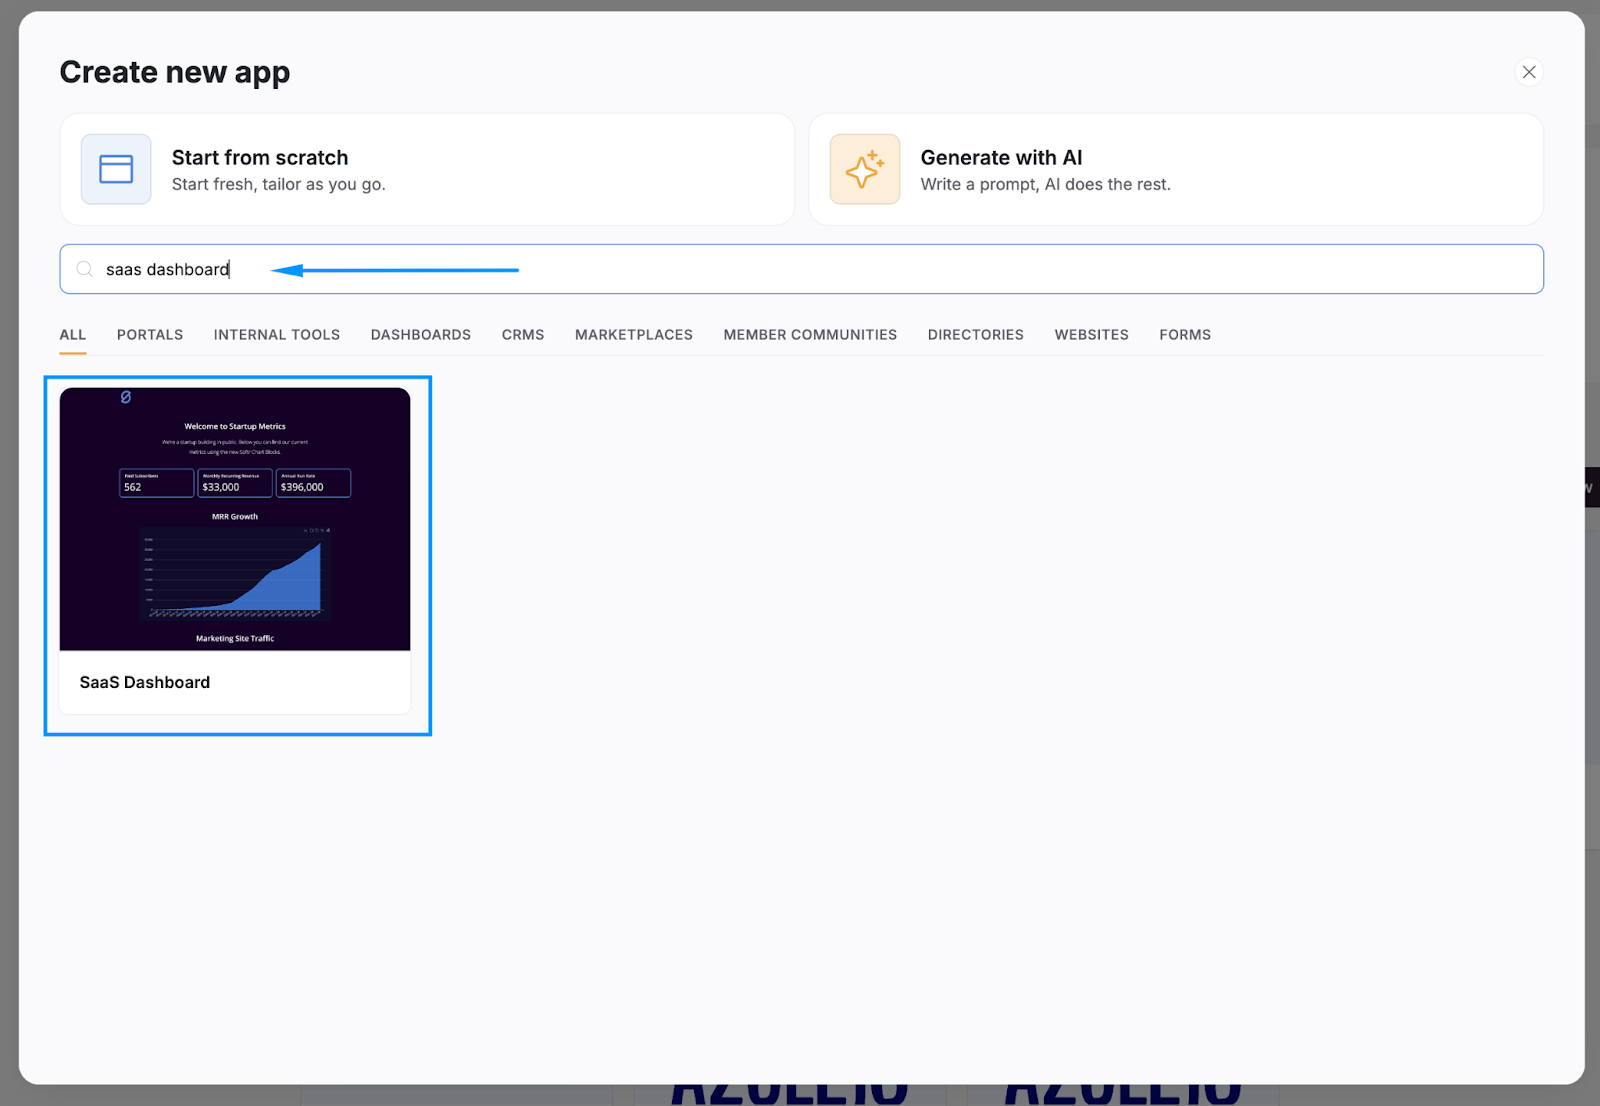
Softr offers a variety of templates you can use or adjust to achieve the dashboard you need. In this guide I will be using the SaaS Dashboard Template. To find it, use the search bar to search for “SaaS dashboard.” Then click on the template with that name.
Step 4: Click on “Use Template”
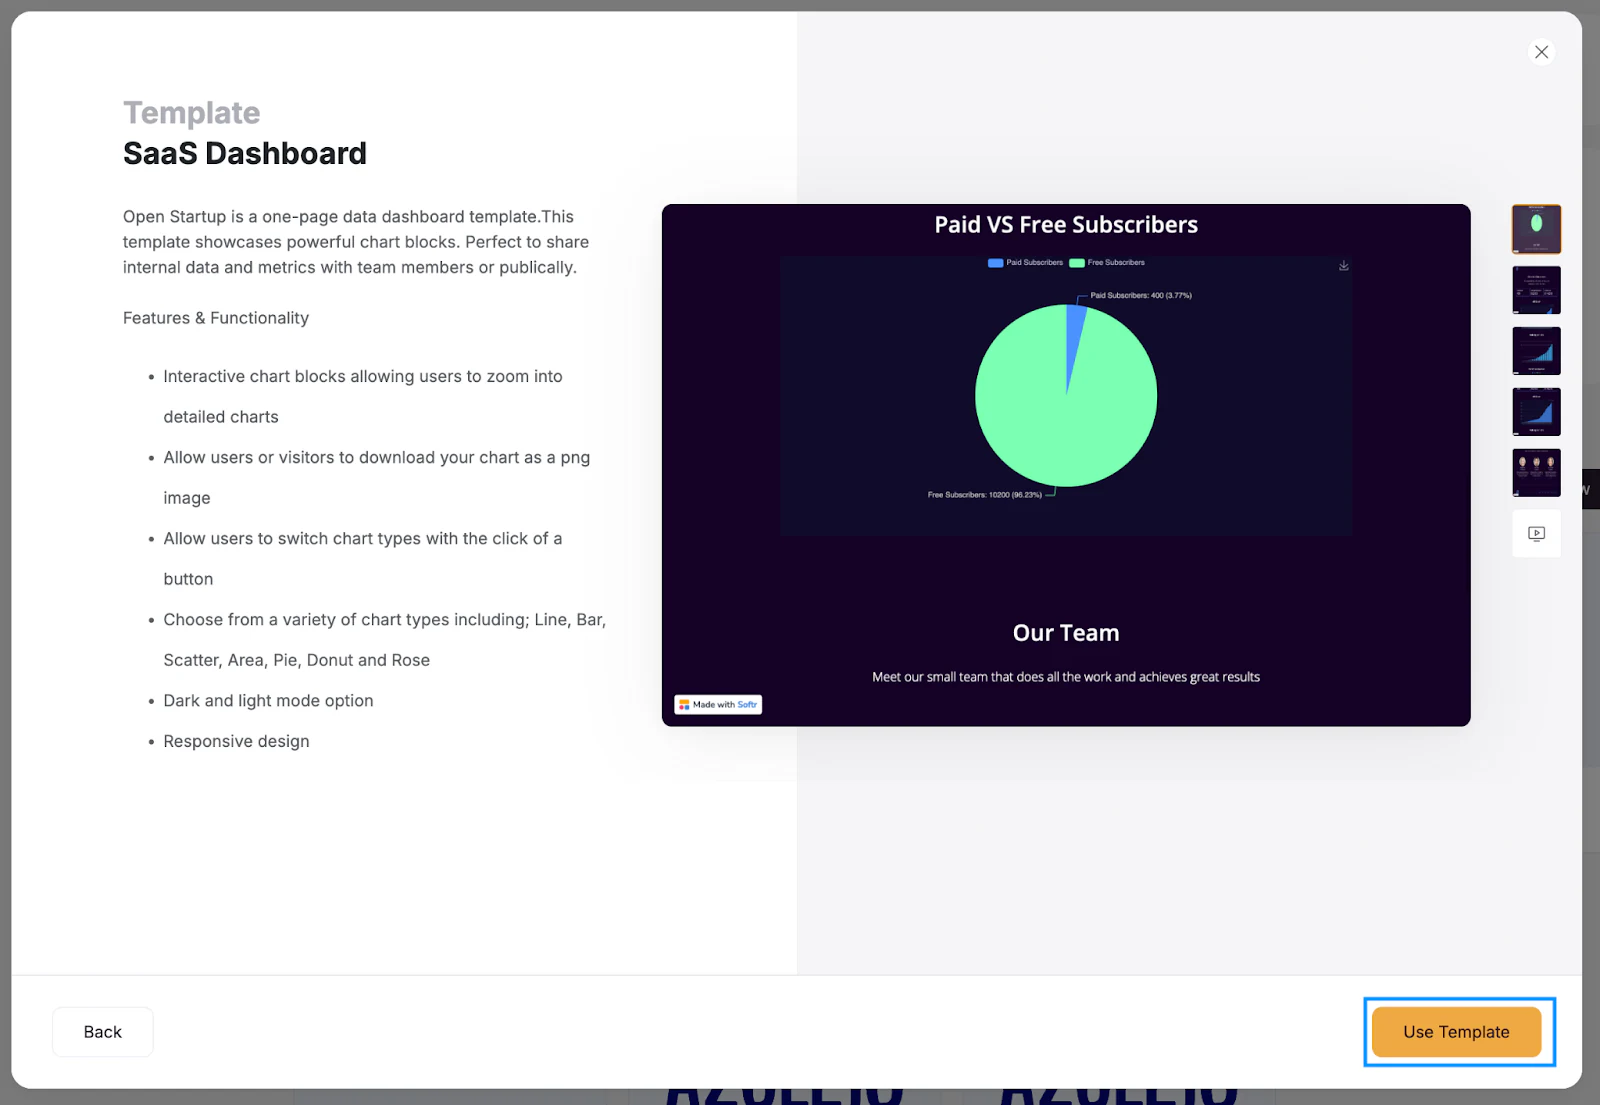
You can now learn more about the template, including its features and functionalities. Once you’re ready, click on the “Use Template” button.
Step 5: Select Airtable as your data source
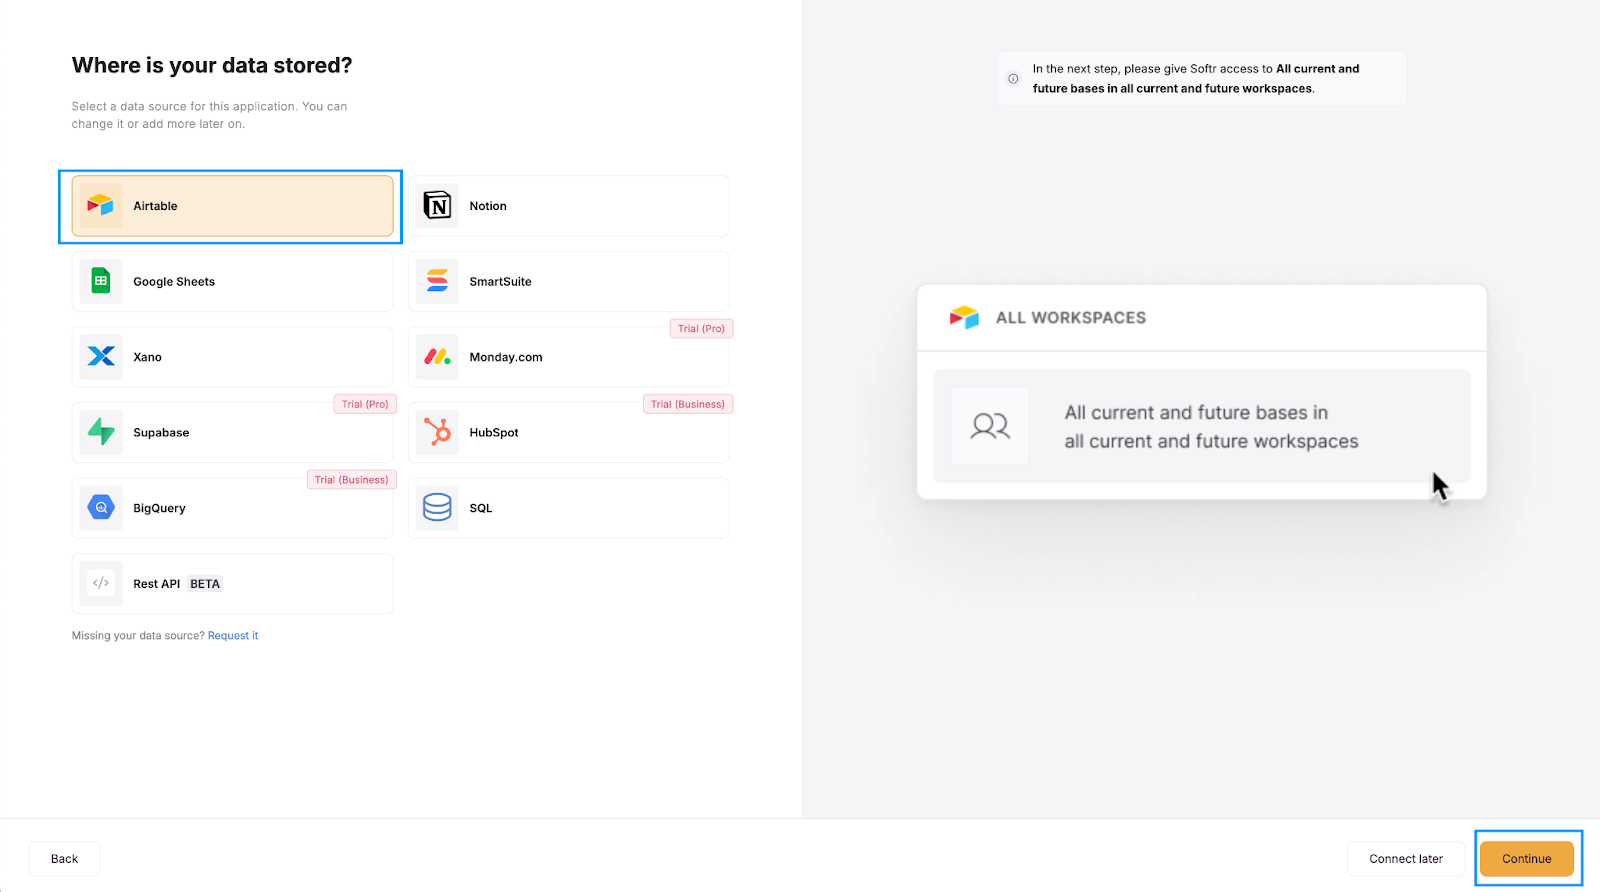
Next, choose Airtable as your data source and click "Continue."
Note: Softr also connects natively to its own Softr Databases, plus 21+ external sources including Google Sheets, HubSpot, SQL databases, Notion, monday.com, and more. If you're starting fresh rather than migrating an existing base, a Softr Database is worth considering since it's built to work natively with the interface, with no API rate limits to manage.
Step 6: Connect to Airtable
Now, a new tab or window will open for you to grant Softr access to your bases on Airtable.
Click on “Add base” and choose “All current and future bases in all current and future workspaces.” When you’re done, click on the “Grant access” button.
Step 7: Copy the Softr template base to Airtable
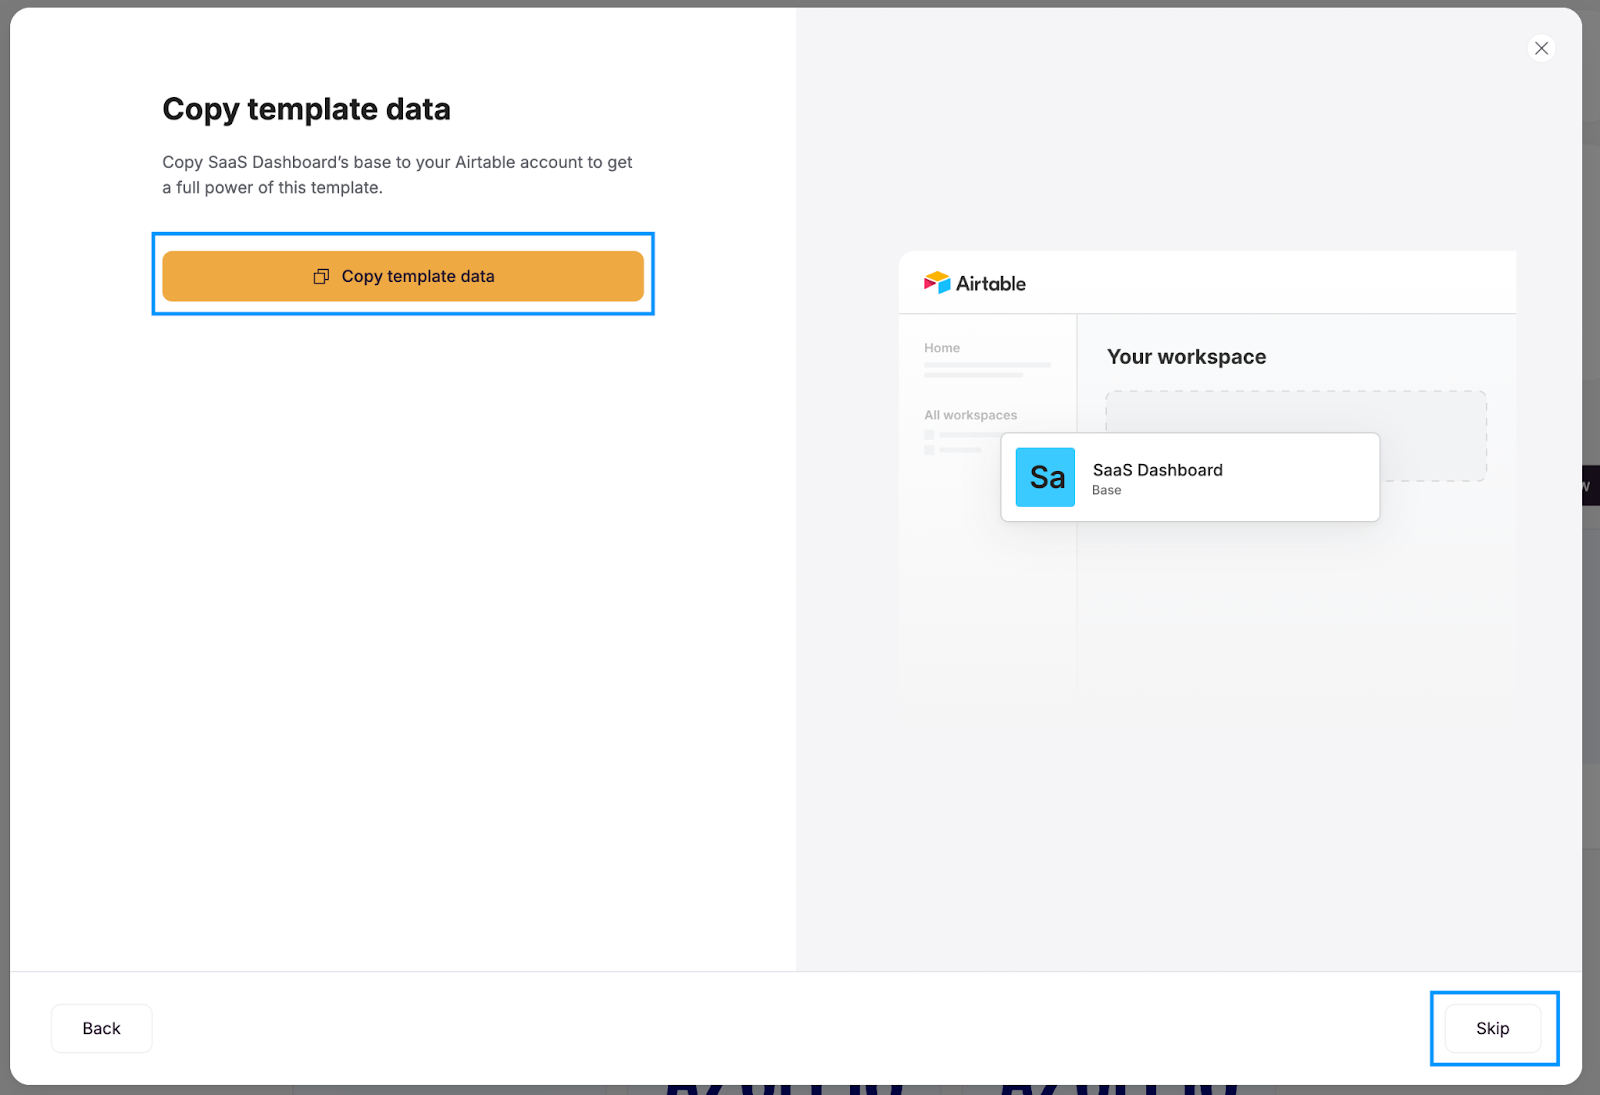
In order to use Softr’s template base for Airtable, click on “Copy base to your Airtable account.” If you want to start using your own Airtable data, click “Skip.”
Step 8: Customize your dashboard’s blocks
After having your table in your Airtable workspace, you just need to click on “Go to application.”
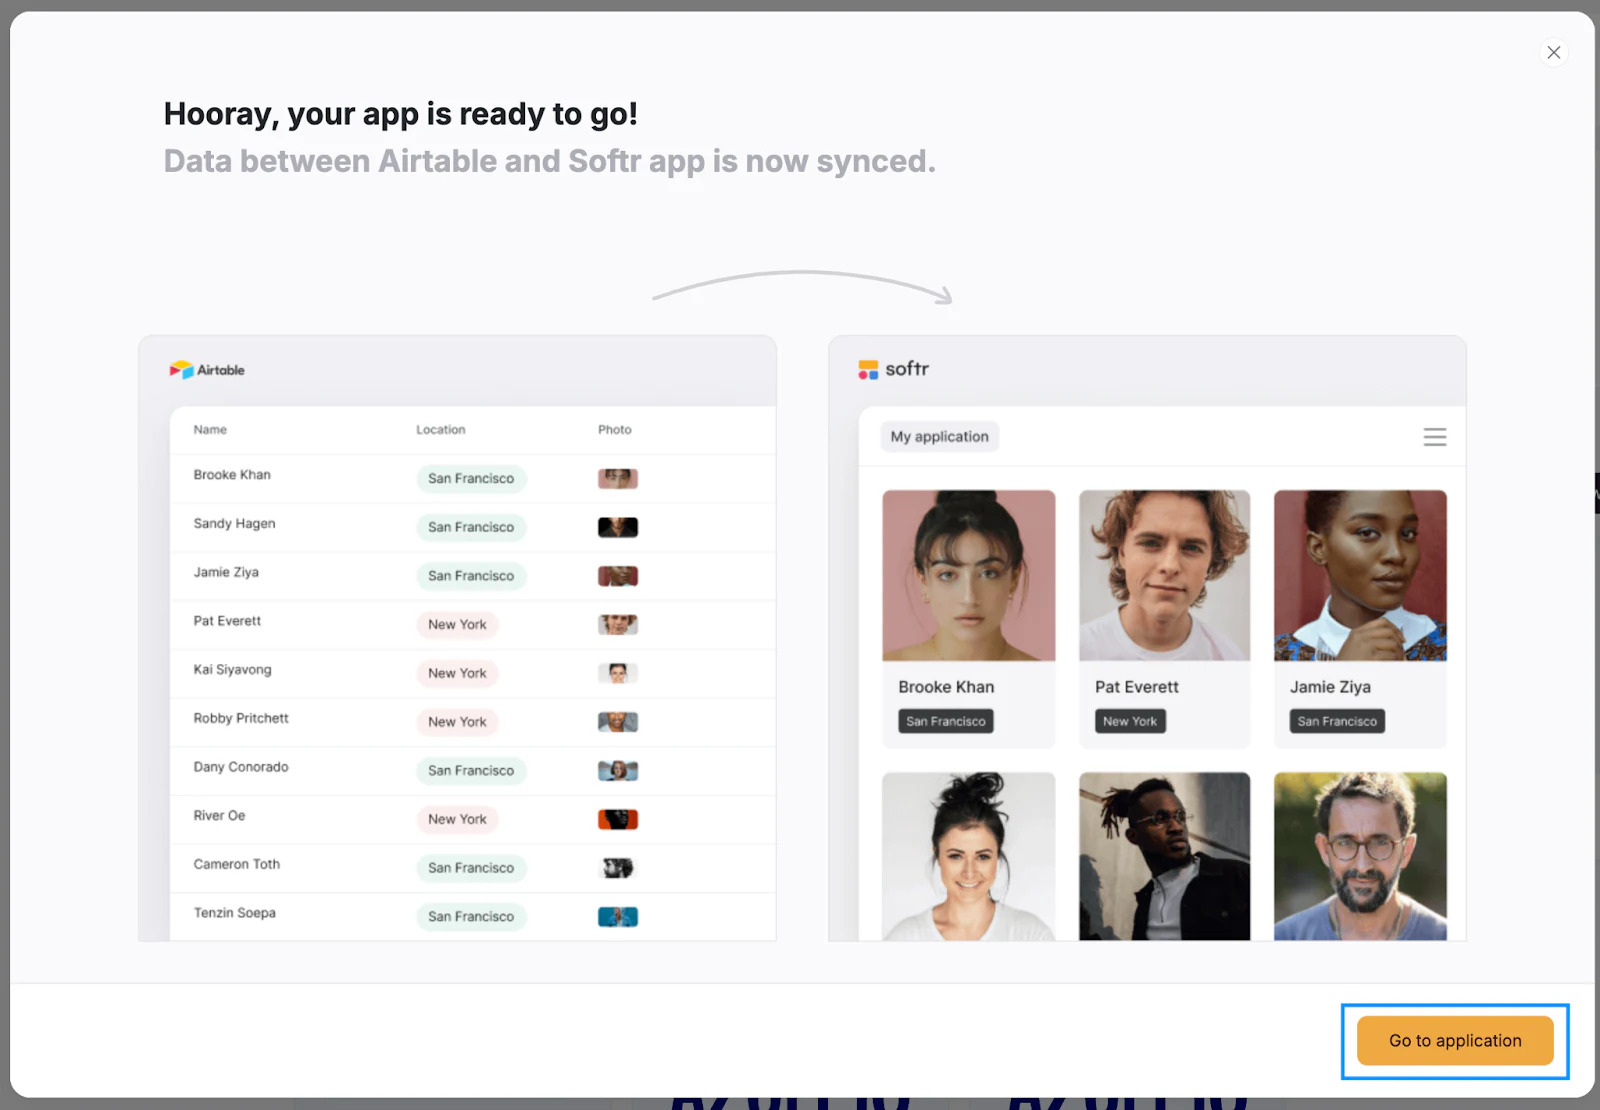
The basics are done! You now have a dashboard. Feel free to edit the content of your base and change the data shown and its design.
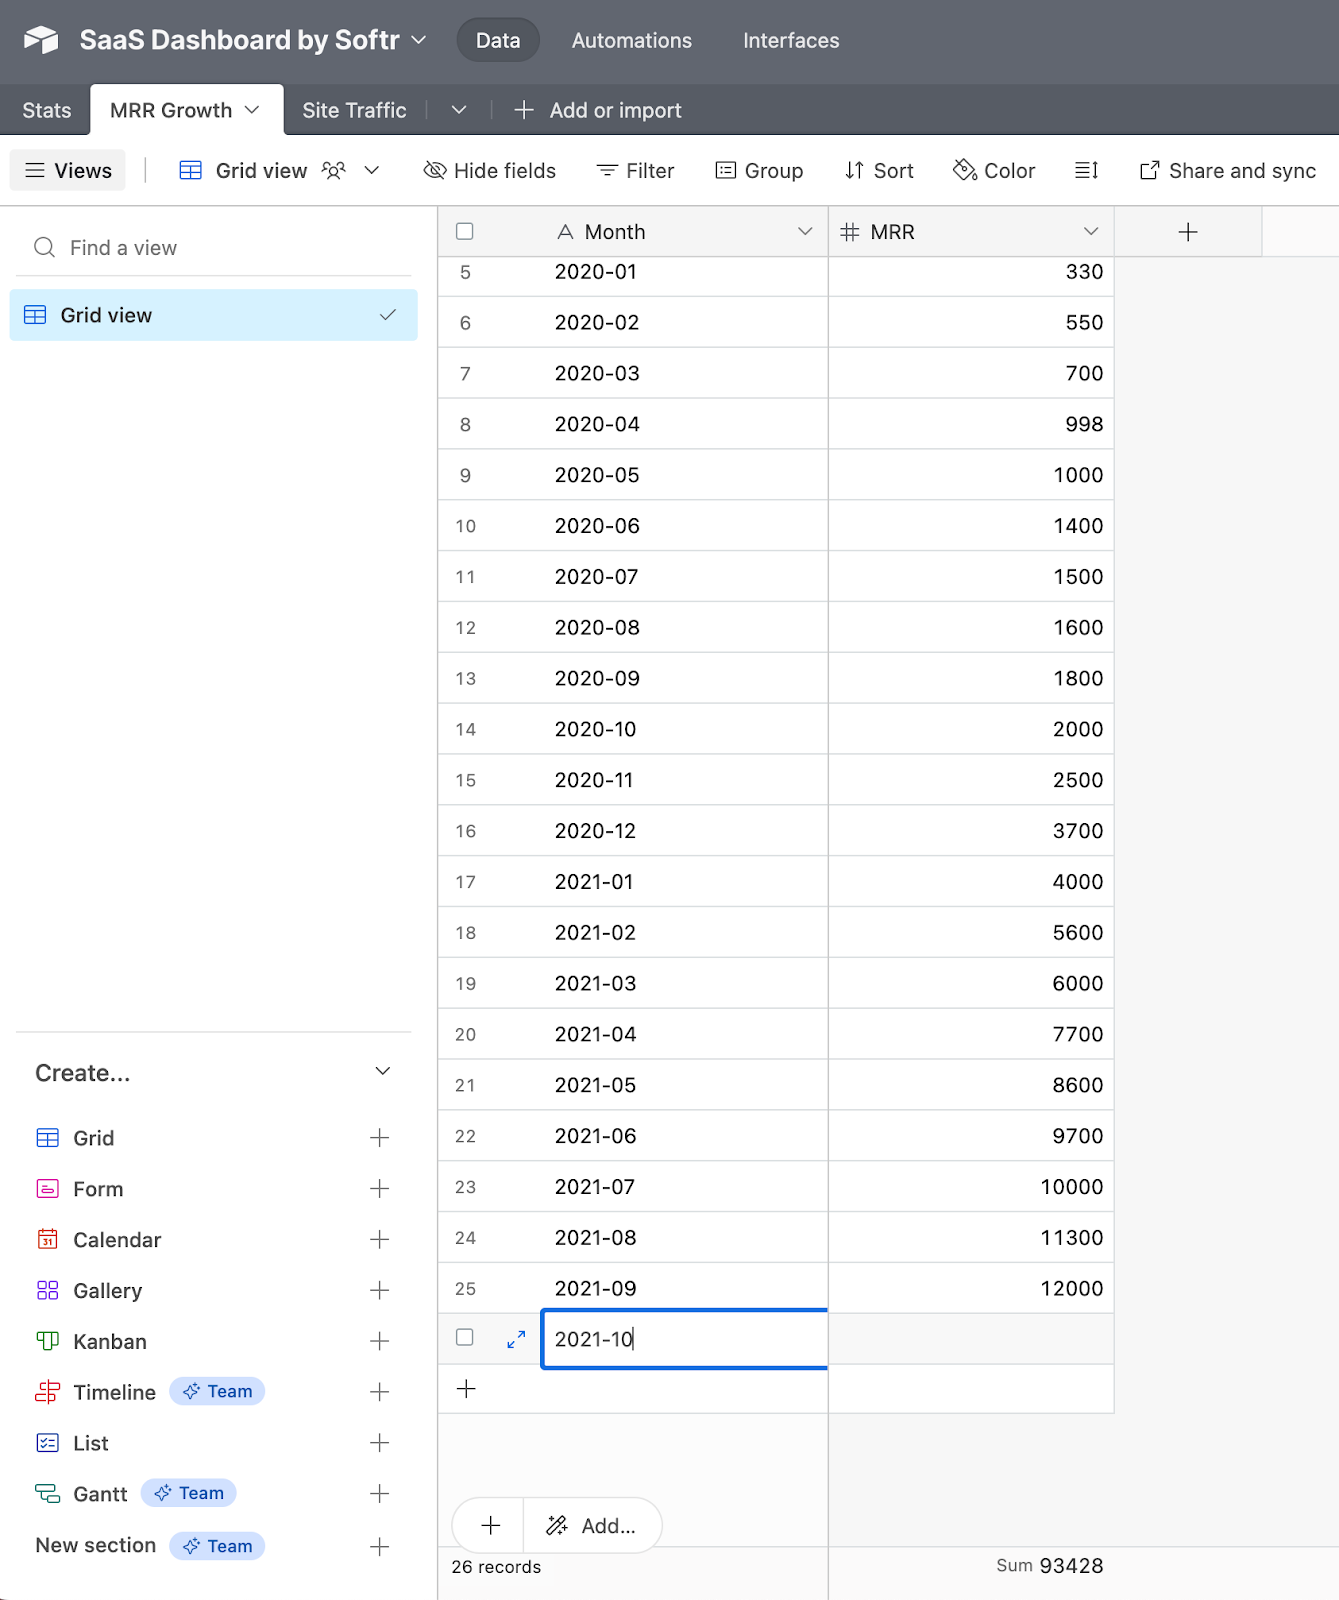
Step 8.1: Populate Airtable with your own data
Add or replace the data on the newly created “SaaS Dashboard by Softr” base in your Airtable’s workspace. Feel free to add more tables, fields or views if you need.
Step 8.2: Adjust your blocks’ settings
When you click on a pre-built block, a sidebar opens on the right side of the screen. Navigate through the tabs to adjust the data source and filtering settings, edit the displayed content, and customize style and visibility.
Step 8.3: Add new blocks
On the top-right corner of the Softr Studio page, or at the beginning and end of each block, you'll find a plus sign. Click it to add a new block, choose the block you need, and adjust its settings as shown in the previous step. Alternatively, describe what you want to the AI Co-Builder (for example, "add a bar chart showing revenue by month") and it will add and configure the block for you, which is especially handy when you need to set up several charts or KPI cards at once.
Step 9: Publish your app
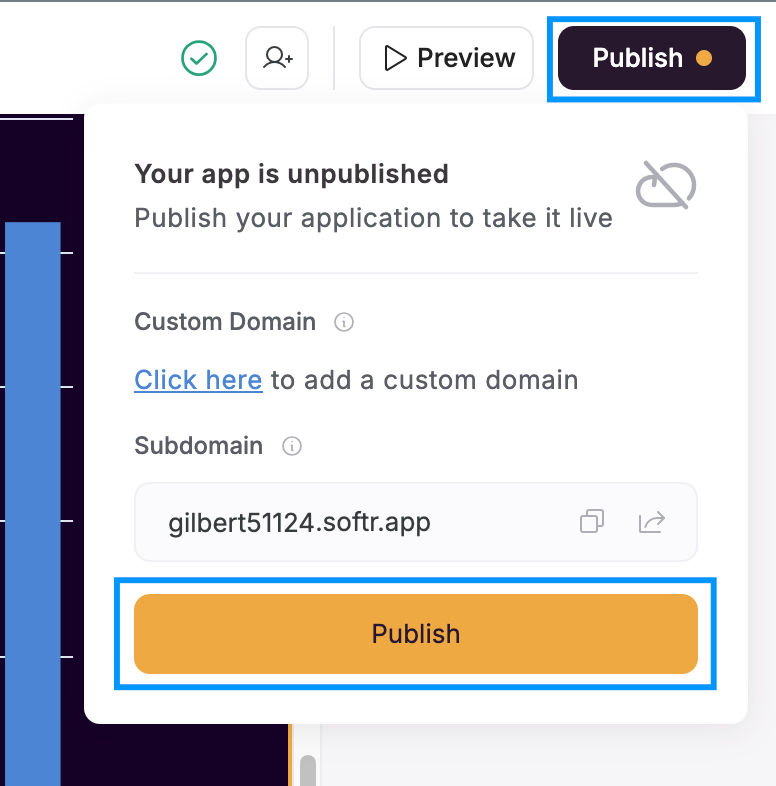
Now that you have everything set, publish your app. Click the “Publish” button on the top bar.
Step 10: Share your app
You have created a dashboard integrated with your Airtable data. You can now share it with your team or stakeholders.

Examples of Airtable dashboards
To illustrate the versatility of Airtable dashboards, here are examples of completed dashboards created using Airtable and Softr. These examples emphasize diverse styles and use cases tailored to specific needs:

Financial management dashboard
Officeheads, a financial management firm, developed a client portal using Softr integrated with Airtable. This portal provides clients with interactive dashboards displaying real-time financial data, including cash flow, budgets, and financial statements. Clients now monitor their financial health and access personalized insights without emailing back and forth for updated spreadsheets.
Content experience dashboard
Strupek, a content marketing agency, built a Content Experience Dashboard for its clients using Softr, Airtable, and Make. It gives clients real-time access to campaign planning, creative approvals, scheduling, and per-post reporting (impressions, engagement, and monthly rollups pulled straight from Airtable), all through one login. The agency reports a 58% reduction in operational costs and 8 to 10 hours saved per week that used to go into manually generating client reports.
"The easiest way to show clients the value we deliver is to show them." - Strupek team
Project management dashboard
Urban's Landscaping Group, with the assistance of Kyrro Tech, implemented a project management dashboard using Softr and Airtable. This dashboard consolidates project timelines, task assignments, and progress tracking into a unified view, increasing productivity by 25% and improving team coordination.
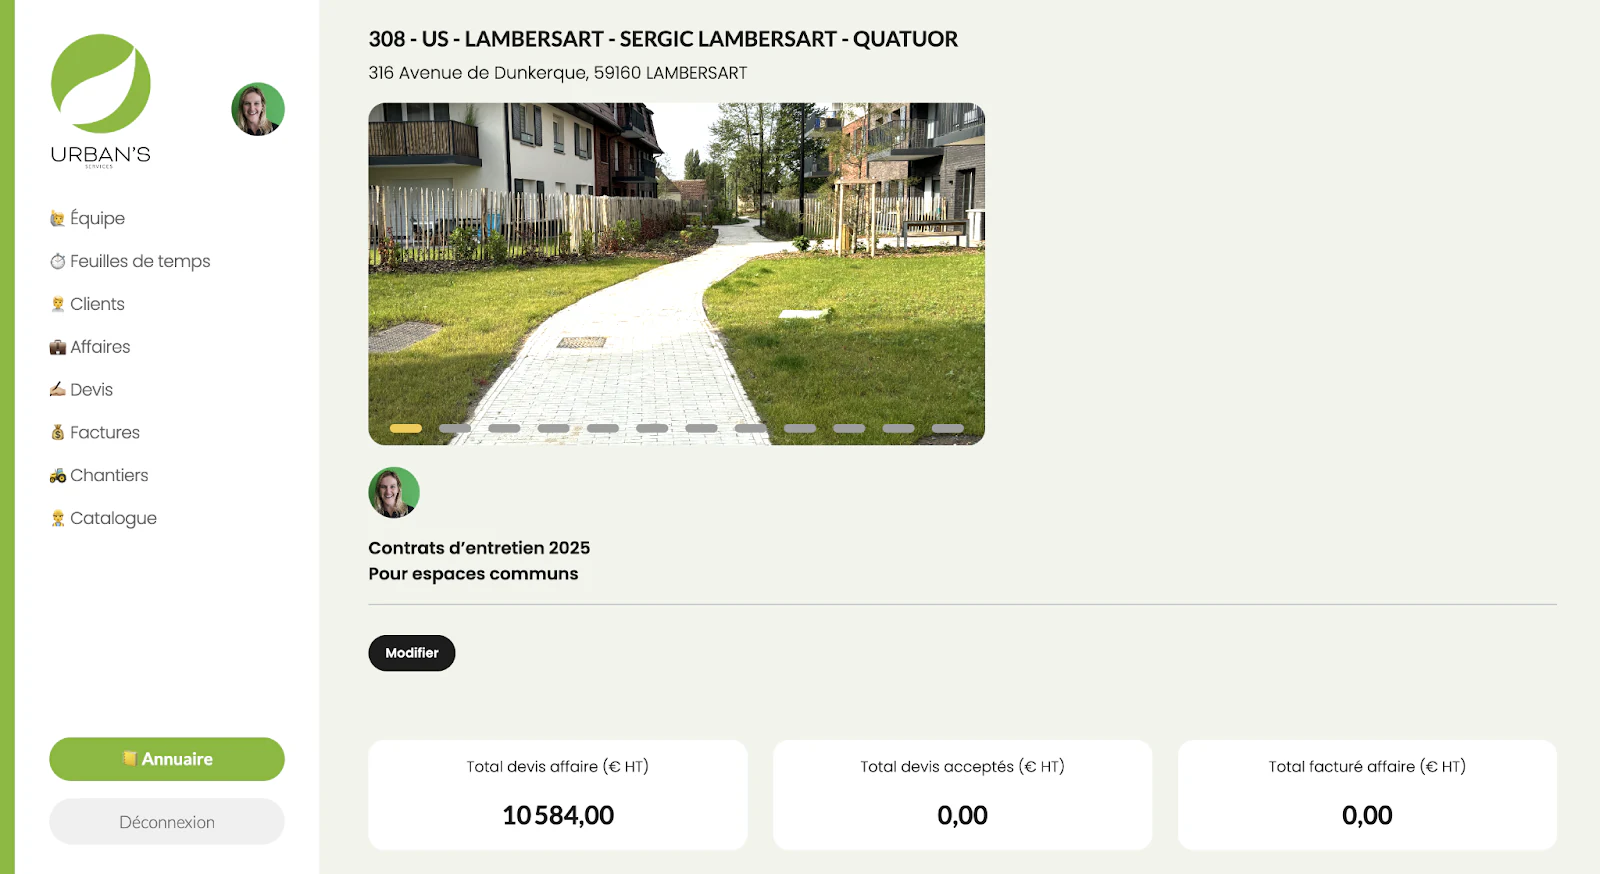
These examples show how combining Airtable's database with Softr's design and permission tools works across industries, from finance to content marketing to landscaping.
Pick the setup that matches who's watching
If your dashboard stays inside your own team, Airtable's Interface Designer gets you there for free, with charts and KPI cards synced live to your base. The moment you need to share that dashboard with a client, vendor, or specific department under different permissions, or want it to look like a polished part of your product, pair Airtable with Softr. Start with the SaaS Dashboard template, connect your Airtable base, and you'll have a branded, permission-controlled dashboard live in an afternoon, not a quarter.
Frequently asked questions
Can I create an Airtable dashboard for free?
What's the difference between an Airtable Interface and an Airtable dashboard?
Can external clients or vendors access an Airtable dashboard securely?
How do I connect a chart or KPI to my Airtable data in a dashboard?
Should I use Airtable's Interface Designer or Softr to build my dashboard?