7 top client dashboard software that simplifies reporting


[.blog-callout]
TL;DR
- Client dashboard software gives clients real-time, self-serve access to their own metrics, replacing manual reports and status update calls.
- The 7 tools compared here are Softr, AgencyAnalytics, Databox, DashThis, Whatagraph, Klipfolio, and Teamwork.
- Softr stands out for teams that want a fully branded, permission-controlled dashboard connected to live data, not just a marketing analytics view.
- Marketing-specific tools (AgencyAnalytics, Whatagraph, DashThis) are stronger if you only need channel reporting; broader platforms like Softr fit better once you need permissions, forms, or a full client portal. [.blog-callout]
If you're managing client projects, you know how much time reporting can take. Pulling data from different tools, formatting updates, and responding to every status check eats into your day fast. That's where a client dashboard comes in. It gives your clients a single place to view progress, metrics, and results in real time.
In this post, we'll break down seven top client dashboard tools that help you keep clients informed without the busywork. Whether you're a freelancer, agency, or small team, there's an option that fits your workflow.
| Tool | Best for | Standout features | Pricing |
|---|---|---|---|
| Softr | Building branded client dashboards fast, without code | AI Co-Builder, granular permissions, native database | Free; paid plans from $19/month |
| AgencyAnalytics | Scalable, white-labeled marketing reporting | 80+ integrations, built-in SEO tools | From $12/client/month |
| Databox | Real-time performance tracking across sources | 100+ integrations, goal tracking, mobile app | Free; paid plans from $59/month |
| DashThis | Simple, plug-and-play client dashboards | Pre-built templates, automated email delivery | From $45/month |
| Whatagraph | Visual, cross-channel marketing reports | 45+ integrations, drag-and-drop editor | From $223/month |
| Klipfolio | Highly customizable, data-rich dashboards | Custom formulas, 100+ integrations | Free; paid plans from $125/month |
| Teamwork | Combining project management with client reporting | Time tracking, client permissions | Free; paid plans from $10/user/month |
What is client dashboard software?
Client dashboard software lets businesses share real-time data, project updates, and performance metrics with their clients in a centralized way. These dashboards are often customizable, branded, and interactive, so clients can track their own KPIs without needing constant manual updates.

They help service-based teams and agencies reduce back-and-forth communication, increase transparency, and reinforce trust by keeping clients in the loop.
Types of client dashboard software
Client dashboard tools typically fall into a few functional categories, depending on what kind of experience you're looking to deliver:
1. Marketing analytics dashboards focus on aggregating and visualizing campaign data across channels. They're ideal for reporting on SEO, paid ads, email performance, and more.
2. Business intelligence dashboards offer advanced customization, calculated metrics, and broad integration capabilities, suited for teams working with complex or high-volume data.
3. Real-time performance dashboards prioritize live updates, mobile accessibility, and goal tracking to help teams monitor fast-moving metrics without delay.
4. Project visibility and collaboration dashboards combine client reporting with task tracking and timeline visibility, which is useful when clients need ongoing insight into project progress and results.
What to look for in client dashboard tools
Not every dashboard tool is built the same. Here are the key features to keep an eye on when comparing options, whether you go with a dedicated no-code dashboard builder or a marketing-specific reporting tool.
Real-time data syncing
Keep your dashboards current without manual refreshes. This reduces back-and-forth and ensures clients always see up-to-date metrics.
White-label customization
Brand the dashboard with your own logo, domain, and colors. It helps you deliver a more polished, professional experience, which matters most for agencies.
Flexible integrations
Look for tools that connect easily to your existing data stack, whether that's a native database, Google Analytics, HubSpot, Airtable, or Stripe.
Report automation
Set up recurring reports that go out on a schedule. It saves hours of manual work and keeps clients in the loop without extra effort.
Permission controls
Limit who sees what. This is essential when managing multiple clients or internal stakeholders with different levels of access.
7 best client dashboard software for 2026
1. Softr
Best for building client dashboards fast and without code

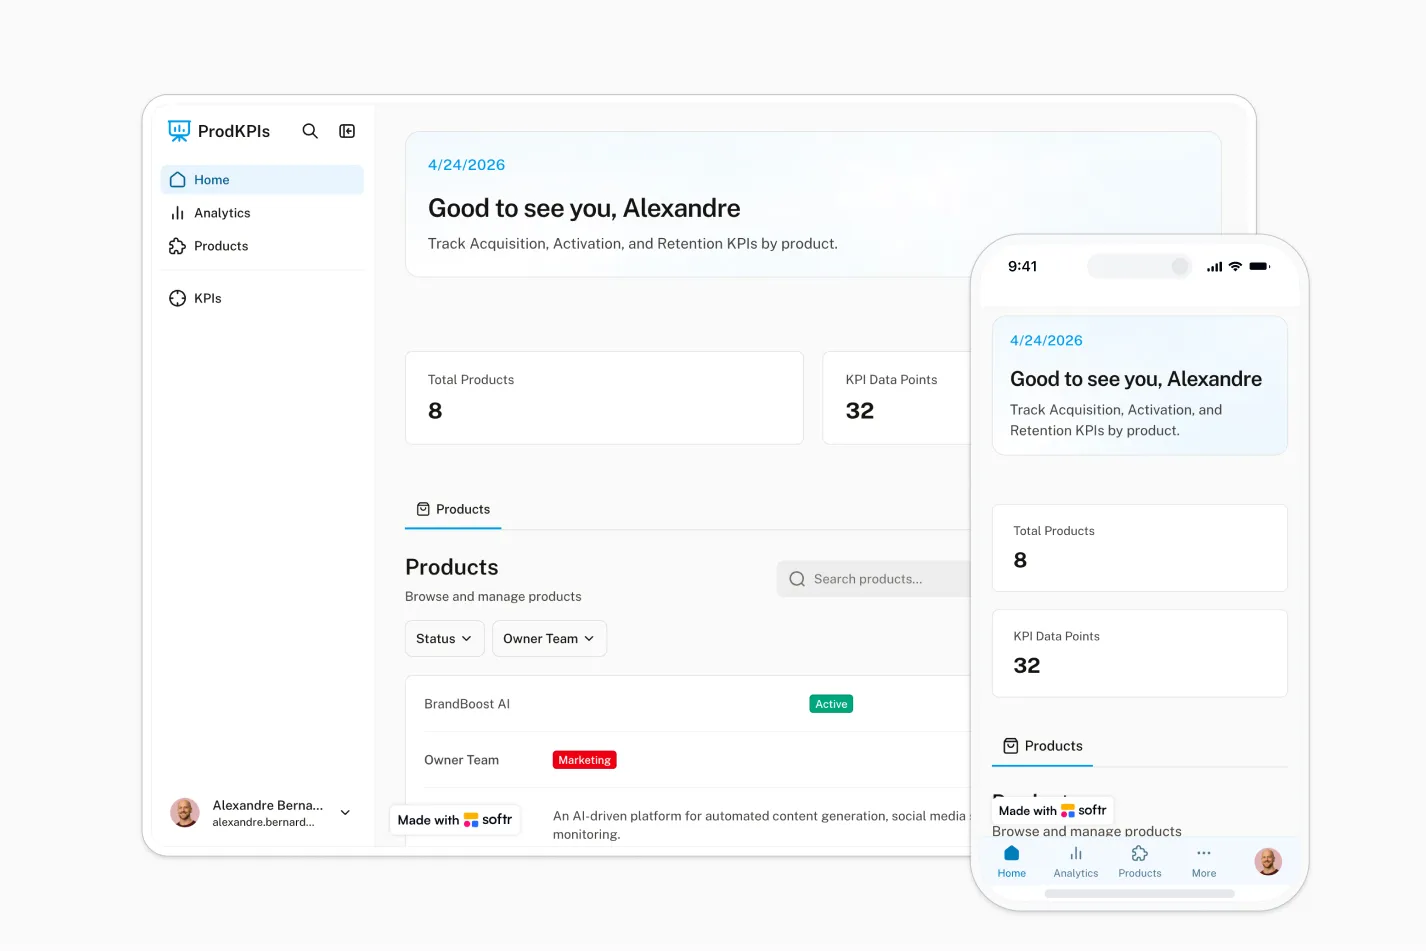
Softr is a no-code platform for building branded client dashboards that pull your data into one place. You can describe what you need to the AI Co-Builder and it assembles the dashboard, database, and permissions for you, or start from a template and adjust it visually. For data, Softr Databases is the fastest native option, and Softr also connects to 17+ external sources, including Airtable, Google Sheets, HubSpot, and Notion, or any tool via REST API.
Who is Softr best for
It's built for teams that want to give clients a clear, self-serve view of their projects without relying on developers or sending manual reports. You can control exactly what each client sees, from project status to KPIs, and update everything in real time.
FUGA, a music distribution agency, replaced manual PDF reports and repetitive spreadsheet sharing with a Softr-built client portal. The team now saves more than 5 hours a week on reporting for 800+ users:
"We really appreciate how we can set user-specific visibility. Clients see only what they need to see, nothing more." - FUGA, customer story
Softr pros
- AI Co-Builder for setup: Describe your dashboard and the AI Co-Builder generates the database, pages, and blocks for you, then you fine-tune it visually.
- Connects to live data: Softr Databases is the native option, plus 17+ external sources like Airtable, Google Sheets, HubSpot, Notion, and SQL, or any custom source via REST API.
- Granular user permissions: Show each client only what's relevant to them with role-based access controls, so one dashboard can serve every client differently.
- White-label ready: Add your own logo, colors, and custom domain to deliver a fully branded client experience.
- Custom visuals when you need them: For charts or layouts the pre-built blocks don't cover, the Vibe Coding block generates a custom component from a plain-language prompt, still connected to your live data and permissions.
- Scales beyond dashboards: Expand into full client portals, request forms, document sharing, or internal ops, all from the same platform.
Softr cons
- Not built for heavy analytics: Softr works best for operational dashboards, not deep data analysis or BI use cases.
- Fewer pre-built chart types: Out of the box, you get fewer native chart types than dedicated BI tools like Looker or Power BI (the Vibe Coding block covers most gaps, but it's an extra step).
Pricing
Softr offers a free plan for simple dashboarding needs, with paid plans starting at $19/month.
- Free: Unlimited apps, with access to Softr Workflows and Softr Databases, 5 app users, 5,000 database records, 5 AI credits
- Basic ($19/month): Unlimited apps with 42+ integrations, Team: 5 + Client: 5 app users, 50,000 database records, 10 AI credits
- Pro ($99/month): Unlimited apps with 45+ integrations and custom code, Team: 10 + Client: 50 app users, 500,000 database records, 50 AI credits
- Business ($329/month): Unlimited apps with 52+ integrations, Team: 30 + Client: 100 app users, 1 million database records, 100 AI credits
- Enterprise: Contact sales for custom limits, SSO, and dedicated support
2. AgencyAnalytics
Best for scalable, white-labeled client reporting

AgencyAnalytics is a client reporting platform built for marketing agencies. It pulls in data from 80+ tools, like Google Analytics, HubSpot, and Facebook Ads, and turns it into branded, easy-to-understand dashboards.
It’s a good fit for agencies that want to automate client updates, reduce manual reporting, and present a polished, on-brand experience at scale.
Key features
- 80+ integrations including SEO, PPC, email, and social platforms
- White-label dashboards with your own domain, logo, and report branding
- Automated reports with scheduling and recurring delivery
- Client logins with custom access and permissions
- Built-in SEO tools like keyword tracking and backlink monitoring
AgencyAnalytics pros
- Designed for multi-client reporting
- Fully branded client experience
- Easy to automate recurring reports
AgencyAnalytics cons
- Limited layout flexibility
- Focused mainly on marketing data
Pricing
Free 14-day trial available on all plans.
- Freelancer: $12/client/month
- Agency: $18/client/month (adds full white-labeling and SEO tools)
- Enterprise: Custom pricing
3. Databox
Best for real-time performance tracking across multiple sources

Databox is a dashboard platform that brings all your KPIs into one live, visual workspace. You can connect data from over 100 sources, like HubSpot, Google Analytics, and Stripe, and build custom dashboards without code.
It’s best for teams that want to monitor performance in real time and reduce the need for manual reporting. With mobile access and alerts, Databox is especially useful if you’re managing multiple metrics across departments or clients.
Key features
- 100+ native integrations across sales, marketing, finance, and support tools
- Custom dashboards with drag-and-drop editor
- Real-time updates and mobile app access
- Data calculations for setting goals and tracking progress
- Scheduled reporting and performance alerts
Databox pros
- Easy to build real-time dashboards without coding
- Great for goal tracking and performance visibility
- Mobile-friendly with strong reporting automation
Databox cons
- Some advanced features are gated behind higher-tier plans
- Can feel overwhelming for non-technical users initially
Pricing
- Free: Up to 3 dashboards and 3 data sources
- Starter: $59/month
- Professional: $169/month
- Performer: $399/month
- All plans include real-time data syncing; paid plans increase source and user limits.
4. DashThis
Best for simple, plug-and-play client dashboards

DashThis is a no-fuss dashboard tool built for marketers who want to centralize reporting without a complex setup. It connects with major marketing platforms and lets you generate client-ready dashboards in just a few clicks using pre-made templates.
It’s a solid choice for freelancers or small teams that need to simplify client reporting and reduce back-and-forth without overbuilding or customizing from scratch.
Key features
- Pre-built dashboard templates for quick setup
- 30+ native integrations with tools like Google Ads, Facebook, and Mailchimp
- White-label options including logo, color scheme, and URL
- Automated email delivery of reports
- CSV and Google Sheets support for custom data sources
DashThis pros
- Very easy to use, even for non-technical users
- Fast setup with no learning curve
- Streamlined for marketing data reporting
DashThis cons
- Limited design flexibility beyond templates
- Fewer integrations compared to other tools
Pricing
- Individual: $45/month (3 dashboards)
- Professional: $139/month (10 dashboards)
- Business: $269/month (25 dashboards)
- Standard white-labeling is available from the Individual plan up; all tiers come with unlimited users and a 15-day free trial.
5. Whatagraph
Best for visual, cross-channel marketing reports

Whatagraph is a dashboard and reporting tool designed to bring together data from multiple marketing channels into one clean, visual report. With its drag-and-drop builder and strong branding options, it's especially good for agencies that need to send visually polished updates to clients.
It’s ideal for marketing teams or agencies managing campaigns across platforms like Meta Ads, Google Ads, and LinkedIn. If you're looking to simplify cross-channel reporting and send updates that clients can actually understand, Whatagraph does the heavy lifting.
Key features
- Cross-channel reporting with 45+ integrations
- Drag-and-drop editor for custom dashboard layouts
- Scheduled report delivery via email or client portals
- White-label customization including domain and branding
- Team collaboration tools for shared editing and access
Whatagraph pros
- Clean, client-friendly visuals that are easy to customize
- Great for multi-channel campaign tracking
- Fully white-labeled, even on lower-tier plans
Whatagraph cons
- Limited control over data transformation and calculations
- More expensive than some simpler alternatives
Pricing
- Professional: From $223/month (5 data sources)
- Premium: From $335/month (15 data sources)
- Custom: Tailored plans for larger teams
- All plans include unlimited users, white-labeling, and automated reporting. Free trial available.
6. Klipfolio
Best for highly customizable, data-rich dashboards

Klipfolio is a dashboard platform for teams that need full control over their metrics. It supports custom formulas, calculated metrics, and deep integrations, making it a strong fit for data-savvy teams that want to tailor every part of the dashboard experience.
It's best for analysts, consultancies, or internal teams with more technical needs, especially when you're working with multiple data sources and need advanced filtering, logic, or dynamic visualizations.
Key features
- 100+ data integrations including SQL, REST APIs, and spreadsheets
- Custom metrics builder with advanced formulas
- Real-time data sync and refresh
- Flexible dashboard layout editor with visual widgets
- White-labeling and embedded dashboards
Klipfolio pros
- Very flexible and powerful for custom data logic
- Ideal for teams that need tailored, interactive dashboards
- Advanced control over data visualization and access
Klipfolio cons
- Steeper learning curve than plug-and-play tools
- Can be overkill for basic reporting needs
Pricing
- Free: For individual use with limited features
- Plus: $125/month (up to 4 users)
- Pro: $250/month (up to 10 users, white-labeling included)
- Custom: For larger teams or embedded use cases
- All paid plans include unlimited dashboards and data refreshes. Free trial available.
7. Teamwork
Best for integrating project management with client reporting

Teamwork is a project management platform that combines task tracking, time logging, and client reporting in one place. It allows agencies to manage projects and communicate progress to clients through customizable dashboards and automated reports.
Ideal for agencies seeking a unified solution to manage projects and client communications, Teamwork streamlines workflows and enhances transparency.
Key features
- Customizable dashboards to track project progress and KPIs
- Automated client reporting with scheduled delivery
- Time tracking integrated with billing and invoicing
- Client permissions to control access to specific data
- Integration with tools like Slack, HubSpot, and Google Drive
Teamwork pros
- Combines project management and client reporting in one platform
- User-friendly interface with customizable templates
- Facilitates clear communication with clients through shared dashboards
Teamwork cons
- May have a learning curve for teams new to integrated platforms
- Advanced features may require higher-tier plans
Pricing
- Free Forever: Basic features for small teams
- Deliver: $10/user/month, includes project templates and time tracking
- Grow: $18/user/month, adds advanced reporting and integrations
- Scale: Custom pricing for large teams with complex needs
- All plans offer a 30-day free trial.
Build smarter dashboards to share progress with your clients

Client dashboard tools vary widely in what they offer. Some focus on marketing analytics, others on data depth or simplicity. What works best depends on the kind of visibility you need to give your clients and how much flexibility your team wants in customizing that experience.
Softr is a strong option if you're building something more dynamic, like a dashboard that pulls information directly from Softr Databases or tools you already use, such as Airtable, Google Sheets, or Notion. You can control exactly what each client sees, manage access with a few clicks, and update content without involving developers.
Try Softr for free or explore ready-made templates to get started!
Frequently asked questions
What is the difference between a client dashboard and a client portal?
How much does client dashboard software cost?
Can I build a client dashboard without hiring a developer?
What data sources can I connect to a client dashboard?
Can I show different clients different data in the same dashboard?