
[.blog-callout]
TL;DR
- Google Sheets can build a Gantt chart natively via Insert > Timeline, but that feature is only available on paid Google Workspace plans.
- If you're on a free account, use a ready-made Gantt chart template instead. It works the same way without a subscription.
- Either method gives you a static timeline. If you need the chart to update automatically, notify people, or connect to permissions for clients and vendors, you'll eventually outgrow a spreadsheet. Tools like Softr Databases and Softr Workflows can turn that same data into a live, shareable project tracker. [.blog-callout]
Creating and using Gantt charts in Google Sheets can bring real clarity to complex projects. However, Google Sheets' free version does not include a built-in Gantt chart function, that's a feature reserved for Google Workspace subscribers.
To work around this, this article covers two methods:
- Creating a Gantt chart in Google Sheets from scratch, using Google Workspace.
- Setting up a Gantt chart in Google Sheets using a free, customizable template from Softr, no subscription required.
Creating your Gantt chart in Google Sheets from scratch
The following is a walkthrough for creating a Gantt chart from scratch using Google Sheets, a core part of Google Workspace. As a Workspace subscriber, you get access to features that help you customize and refine your Gantt chart into a dynamic, visual project management tool.
1. Open a new Google Sheet
This guide begins with creating a fresh Google Sheet where we'll set up our Gantt chart. If you already have a sheet with your project data, skip ahead to step 2.
1.1 Navigate to Google Sheets
In your web browser, type sheets.google.com into the address bar and hit "Enter."

If you're already logged in to your Google Account, this takes you directly to the Google Sheets homepage. If not, sign in with your email and password to proceed.
1.2 Create a new Google Sheet
Once you're on the Google Sheets homepage, click the "+ Blank" button to create a new, empty sheet.

Pro tip: There's a faster way to create a new Google Sheet. Type sheets.new into your browser's address bar and hit "Enter." This shortcut instantly opens a fresh, blank sheet.
2. Set up the information
Before diving into the Gantt chart itself, you need a well-structured data set. This section covers how to set up and input your project information effectively.
2.1 Set up the data structure
Label your columns according to your project needs. A Gantt chart needs, at minimum, Task, Start Date, and End Date. You can add other labels too, such as Assignee, Priority, Status, or Duration. Click a cell in the first row, type your header, then hit "Enter" to confirm.

2.2 Input your task information
For each task, fill in the relevant details by typing directly into the matching cells.

Pro Tip: Use Google Sheets' conditional formatting to color-code assignees or task statuses. This adds visual structure and helps you scan the sheet at a glance. Select the cells you want to format, go to Format > Conditional formatting, then set your rules.

3. Insert the Gantt chart into your Google Sheet
With your project information organized, the next step is to insert a timeline, which becomes the visual basis of your Gantt chart.
3.1 Navigate to the Insert menu and choose Timeline
In the menu bar, click Insert, then select Timeline from the dropdown.

3.2 Set the data source of your Gantt chart
A popup window opens for you to select your data range. Click and hold cell A1 (top-left), then drag to the end of your data, covering every relevant cell.
When you're done, click OK.
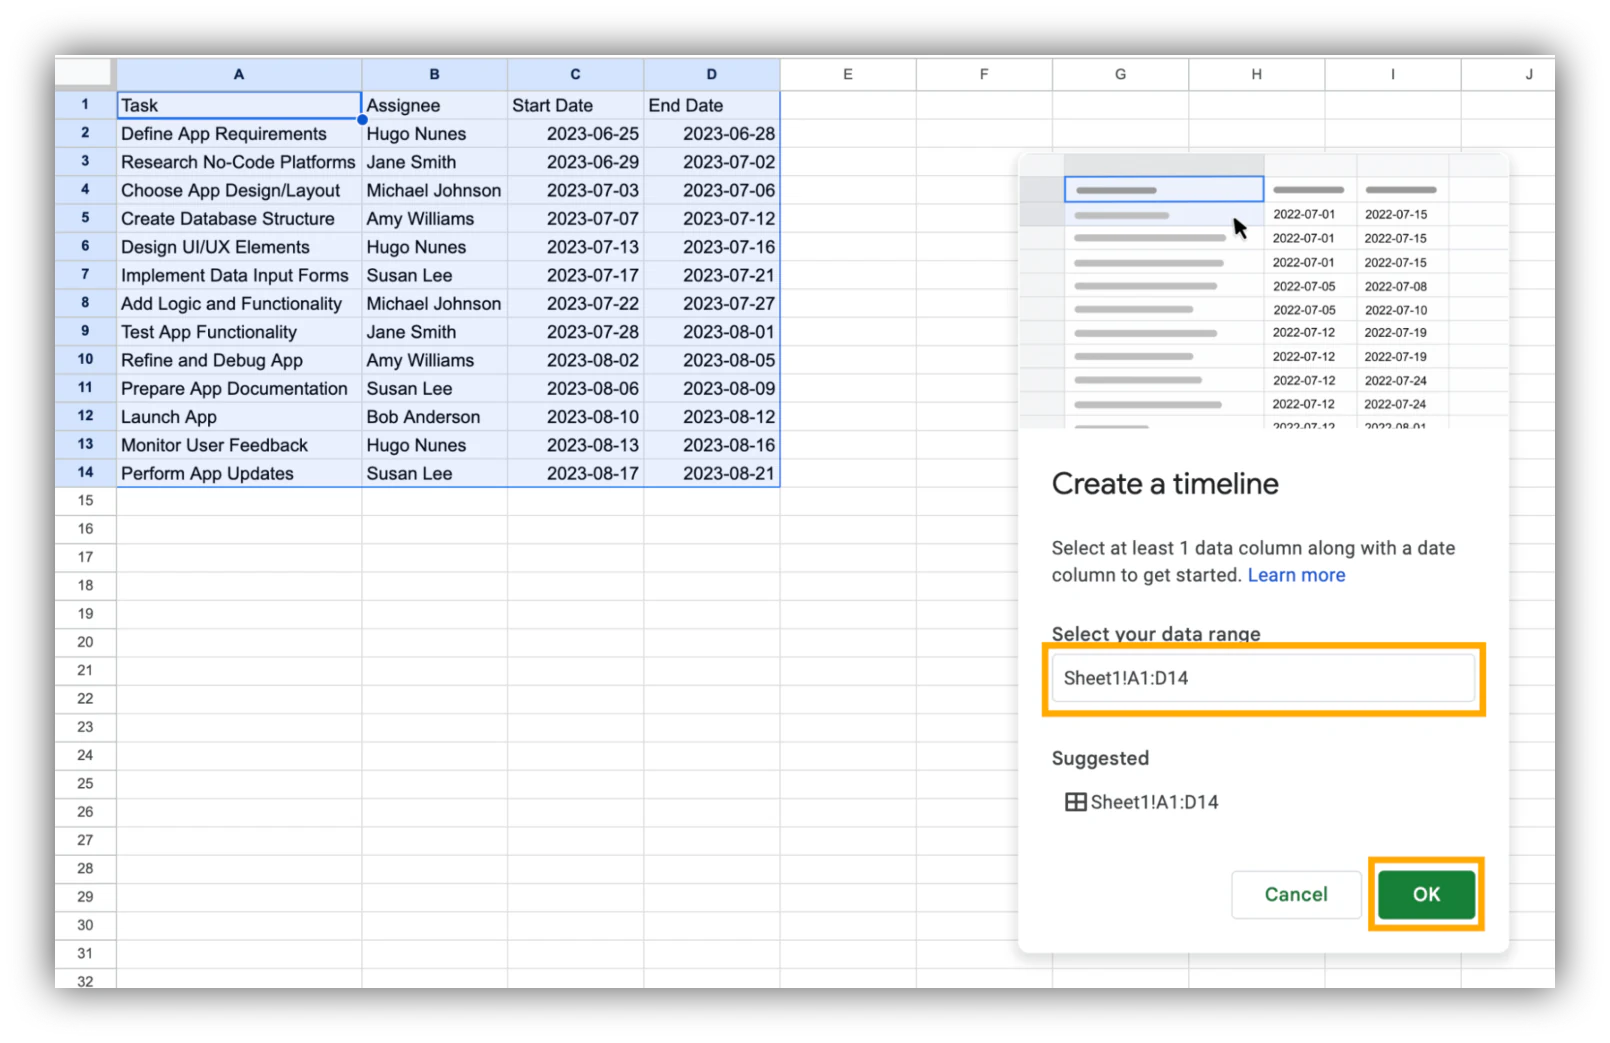
Your Gantt chart is now created. You'll see a new "Timeline" tab in your Google Sheets, showing your project tasks arranged as a visual timeline.

Note that Google Sheets automatically includes new tasks added immediately below your defined range.
4. Explore your Gantt chart settings
Now that your Gantt chart is set up, it's time to fine-tune the details so it fits how your team actually works.

Here's what you can adjust:
- Redefine the data range: If new tasks weren't picked up automatically, or you selected the wrong range initially, go to the Chart editor sidebar and update "Select data range."
- Define start and end date or duration columns: Specify which columns hold your start and end dates, or your task duration, so Google Sheets can plot the timeline correctly.
- Set the card title column: Choose the column that best describes each task (usually "Task") as your card title.
- Specify card color and details: Pick which column drives the color of your task cards (for example, "Status") and where the chart should pull additional details from.
- Group tasks based on a column: Group cards by assignee, project phase, or priority. This makes it easy to see who's carrying the heaviest load at a glance.
The more accurately you configure these settings, the more useful your Gantt chart becomes.
5. Share your Gantt chart
To make sure your team can access the chart, adjust the sharing permissions.
5.1 Select "Share"
On your spreadsheet, click the "Share" button in the upper-right corner.

5.2 Choose "Anyone with the link" under General Access
In the dialog box, under General Access, click the dropdown and select "Anyone with the link." Click "Done" once selected.
Alternatively, share with specific people by entering their email addresses in the "Add people and groups" field and setting their access level.

This works fine for a single chart shared with a small internal team. But notice what's missing: there's no way to give a client visibility into only their own project, no way to restrict a vendor to just their assigned tasks, and no automated alert when a deadline slips. That's the ceiling of a spreadsheet-based Gantt chart, and it's worth keeping in mind as your project list grows.
Setting up your Gantt chart in Google Sheets with our free template
With this method, you'll set up a Gantt chart using a free, ready-made template, no Google Workspace subscription required.
Our template bypasses the complexity of building a Gantt chart from scratch, so you can focus on actually managing your project. Here's how to use it.
1. Accessing the template
The next steps walk you through adding our free template to your Google Drive and setting the right access permissions.
1.1 Visit our Google Sheets Gantt chart template link
Navigate to our Google Sheets Gantt chart template. This takes you directly to the template, hosted on Google Drive, ready for you to personalize.
1.2 Make a copy of the spreadsheet
Open the template and select "Make a copy" from the "File" menu.

Rename your file and select its location, then click "Make a copy."

2. Add your data
Once you've opened your copy of the template, you'll see pre-filled example fields, Task, Assignee, Start Date, End Date, and Status, the core columns most Gantt charts need. This is your chart now, so make it your own.
Replace the example data with your own project information. Click a cell and type in your task names, assignees, start dates, end dates, and statuses. The data reflects immediately in the Gantt chart, giving you a live visual of your project timeline.
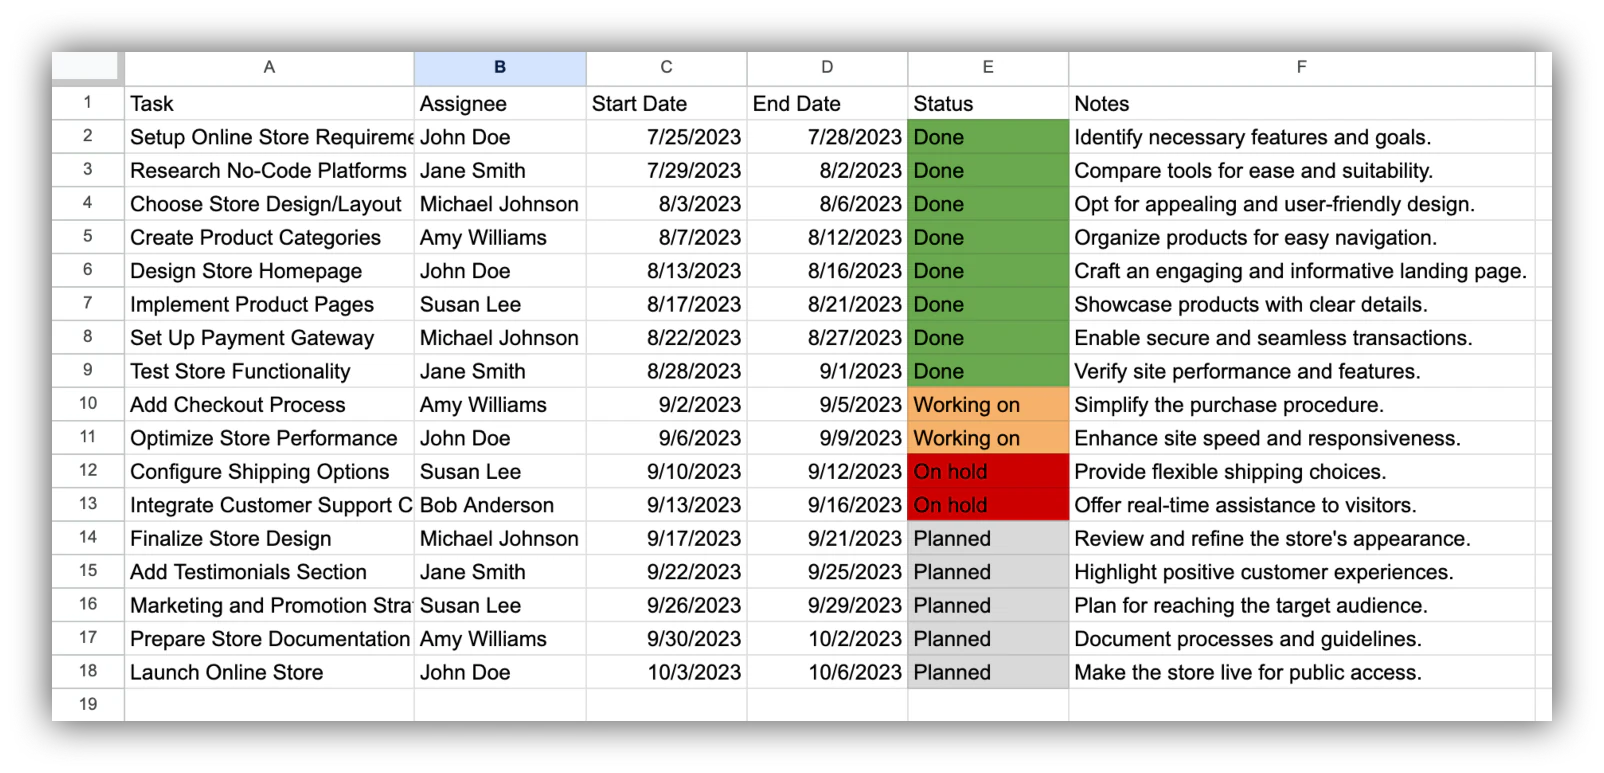
The template is flexible. If your project needs more detail, add columns freely, a "Priority" column to rank tasks, or a "Notes" column for extra context.
3. Edit your Gantt chart settings
After copying the template and filling it with your data, you can adjust the settings further to match your specific project.

Here's what you can adjust:
- Update the data range: The template auto-populates as you fill in tasks. If you added tasks or columns outside the original range, update "Select data range" in the Chart settings sidebar.
- Set start and end date or duration columns: These are pre-set in the template, but if you've rearranged columns, redefine them so the timeline plots correctly.
- Adjust the card title column: Defaults to the "Task" column. Change it if you've added a more descriptive column.
- Define card color and details: Defaults to the "Status" column for card color. You can point this at any other column, and choose where card details are pulled from.
- Group tasks based on a column: Tasks are grouped by assignee by default. Regroup by project phase or priority if that fits your workflow better.
4. Share your Gantt chart
Once you're done, share it with your team.
4.1 Select "Share"
Click the "Share" button in the top-right corner of your spreadsheet.
4.2 Choose "Anyone with the link" under General Access
A pop-up appears. Share with specific people by entering their email addresses and setting an access level, or generate a link for everyone by choosing "Anyone with the link" under General Access.
When finished, click "Done."

When a Gantt chart in Google Sheets isn't enough anymore
A Gantt chart in Google Sheets works well for a single project with a handful of tasks and one internal audience. It starts to break down once you need more than a static timeline: clients who should only see their own project, vendors who need task-level access without seeing your whole sheet, or automatic reminders when a deadline is at risk. Spreadsheets have no permission layer and no logic engine, so all of that has to happen manually.
If you're already at that point, it's worth connecting the same project data to a proper project tracker app instead of adding more tabs and formulas to your sheet. With Softr Databases, you can either keep your data in Google Sheets and connect it, or move it into Softr's own native database for faster performance and deeper permissions. From there, the same task data can power multiple views at once, a Gantt-style timeline, a kanban board by status, a calendar, and a table, all reading from the same source so nothing goes out of sync.
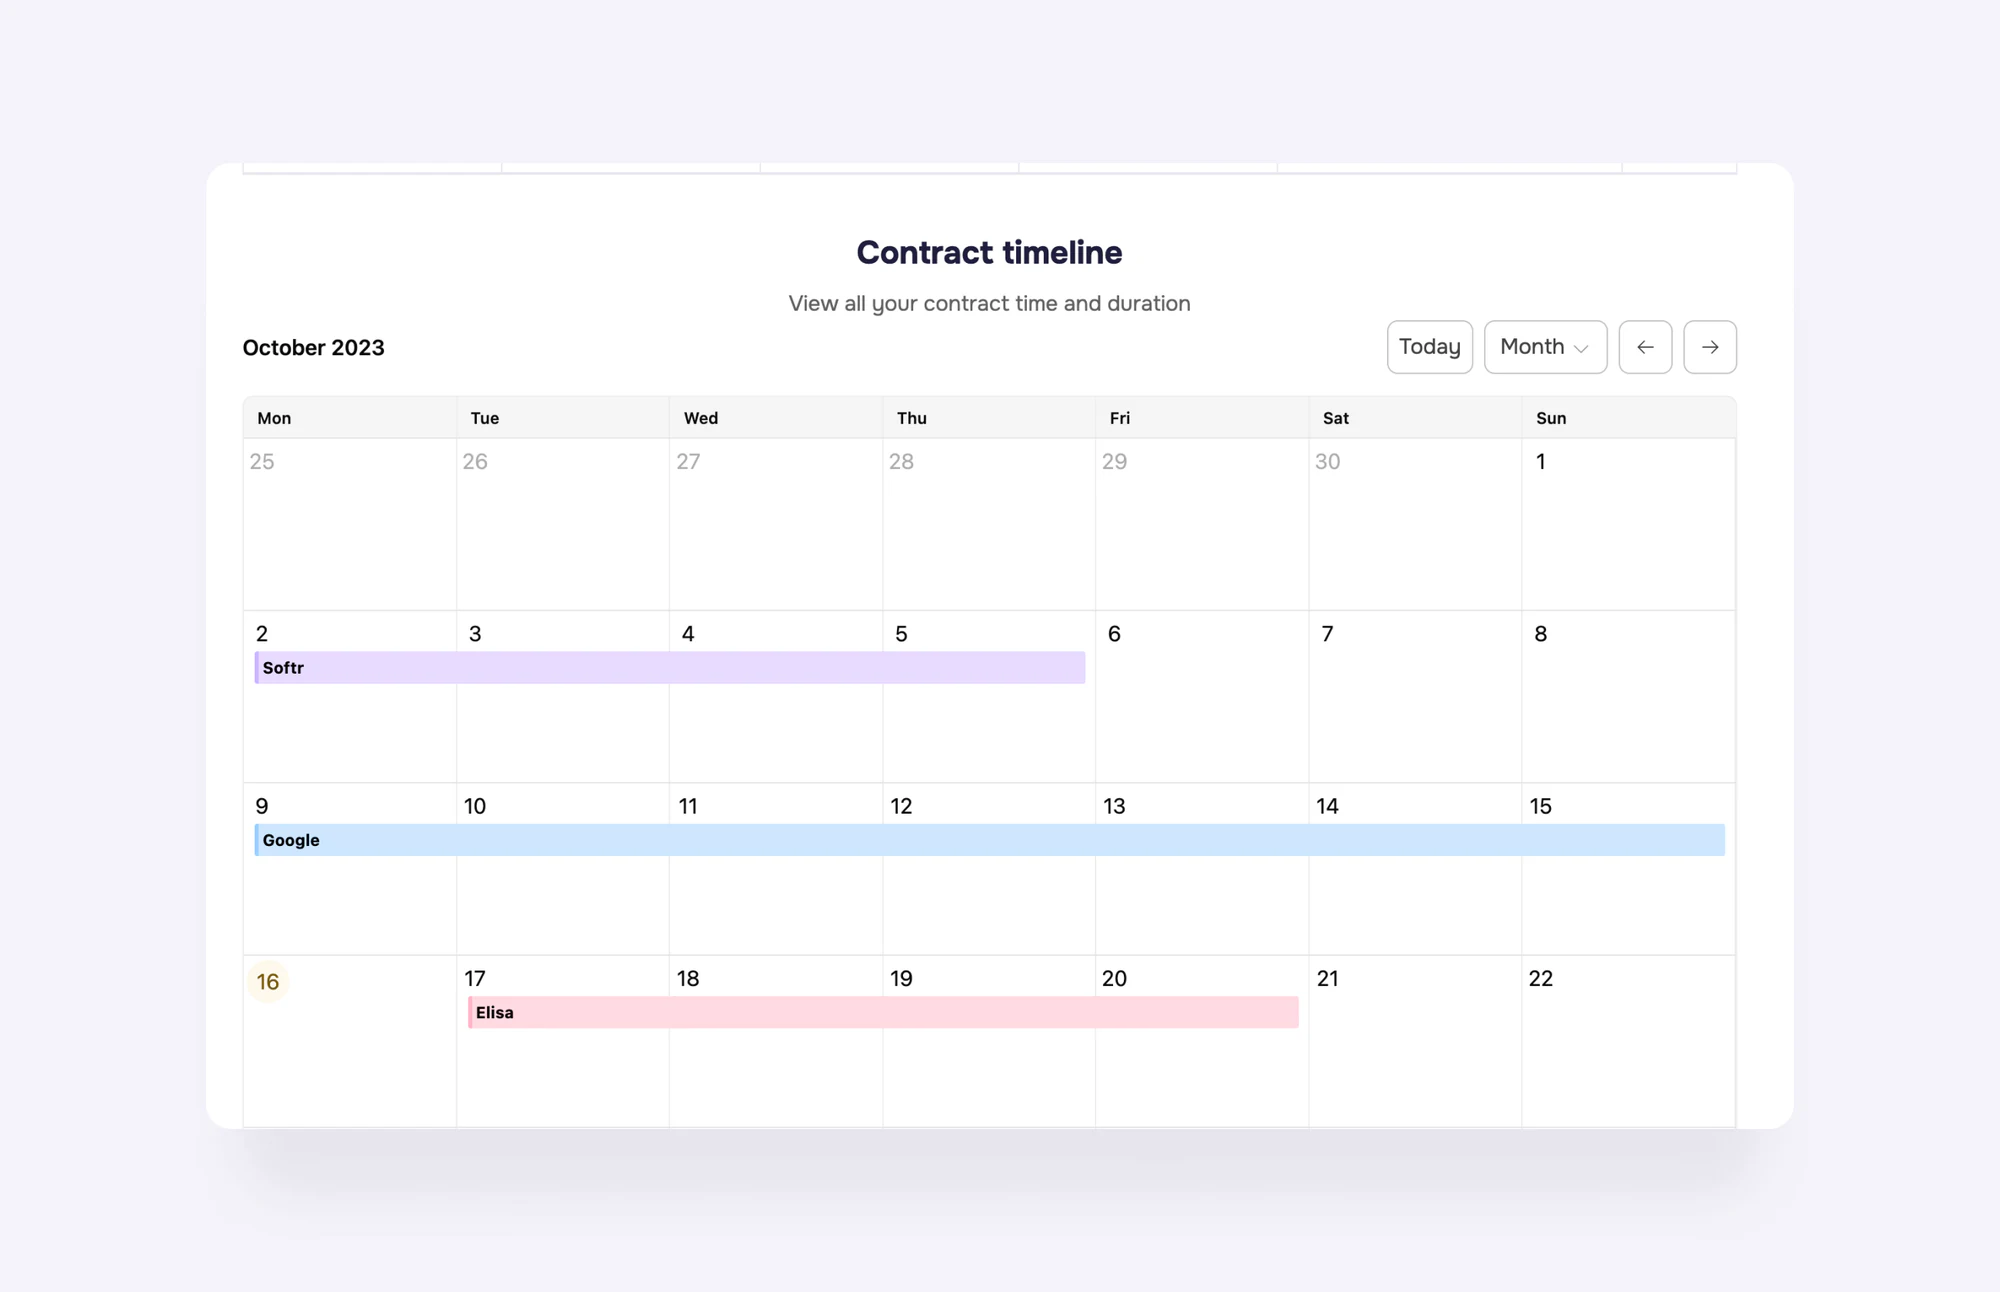
You don't need to build this from scratch either. Describe the tracker you want to Softr's AI Co-Builder and it generates the database, pages, and user groups for you, or start from the project tracker template and customize it. Either way, you get permissions built in from day one: clients see their project, your team sees everything, and Softr Workflows can send a notification the moment a task is marked overdue, something no spreadsheet formula can do on its own.
If your project data currently lives in Google Sheets and you just want to turn it into a working app without moving anything, this guide on building an app from Google Sheets walks through the connection step by step.
Choose the tool that matches your project's complexity
If you're managing one project with a short task list and a small internal audience, the free Google Sheets template covers the job well. But the moment you need to share progress with clients, coordinate across teams, or get notified automatically when something slips, a spreadsheet Gantt chart stops being enough. At that point, connecting your data to a real project tracker app saves far more time than adding another formula ever will.
Frequently asked questions
Do I need a paid Google Workspace plan to build a Gantt chart in Google Sheets?
Can I update a Gantt chart in Google Sheets automatically as tasks change?
What's the difference between a Gantt chart and a project tracker?
Why does my Google Sheets Gantt chart look broken or empty?
Is there a faster way to manage projects than building a Gantt chart from scratch every time?