How to create and set up custom reports in Airtable



[.blog-callout]
TL;DR
- Airtable's Interface Designer lets you build report dashboards (charts, numbers, filters) directly inside your base, free of charge, though granular permissions require a paid plan.
- Raw bases and grids get overwhelming fast. A custom report turns scattered records into a clear, shareable summary for stakeholders.
- If you need to share reports with clients or external partners without exposing your underlying data or paying per Airtable seat, building the report in Softr on top of your Airtable base gives you dedicated permissions, authentication, and app-based pricing instead.
- Softr also lets you go further than reporting: the same app can host your dashboard alongside client portals, forms, and workflows, all connected to Softr Databases or your existing Airtable data. [.blog-callout]
Airtable is a solid tool for storing, organizing, and managing your team's data, but the spreadsheet-database interface it's built around gets overwhelming fast. Digging through multiple bases, views, and filters just to answer a simple question about performance wastes time that should go toward acting on the data.
Custom reports fix that. They turn your raw records into a summary that you and your stakeholders can actually read at a glance, without touching the underlying base.
You can build a report two ways: directly inside Airtable using its Interface Designer, or with a dedicated reporting layer like Softr that connects to your Airtable base. This guide walks through both approaches step by step.
What are Airtable reports?
A report is a clear outline of your data in a real-world context. It gives you and your stakeholders a top-level view of performance against target metrics through tables, charts, graphs, and other visual indicators.
A good report lets you:
- Present performance to leadership without exporting anything manually.
- Spot trends over time at a glance.
- Track progress on project management efforts.
- Monitor budgets, total hours, and task counts through charts like pie charts or pivot tables.
Airtable's core grid view offers limited ways to visualize your data on its own. To get an actual report, you need either Airtable's own Interface Designer, or a dedicated report extension like Softr, which adds advanced customization, permissions, and security on top of your existing base.
{{cta-1}}
Creating a report with Airtable Interface Designer
To help users create graphs, charts, and other visualizations from their Airtable data, Airtable released its Interface Designer.
Why use Airtable Interface Designer
This internal report extension is easy to set up and use. It's a great data fetcher that lets you build report tables and different chart types connected to top of view insights.
The Interface Designer is available on the free plan, but some features, such as granular permissions and advanced controls, are reserved for paid plans starting at $20/month.
Set up a report with Interface Designer
Follow the next steps to learn how to create your report with the Interface Designer.
Step 1: Click on “Interfaces”
In your Airtable base, click on the “Interfaces” tab at the top of the screen.

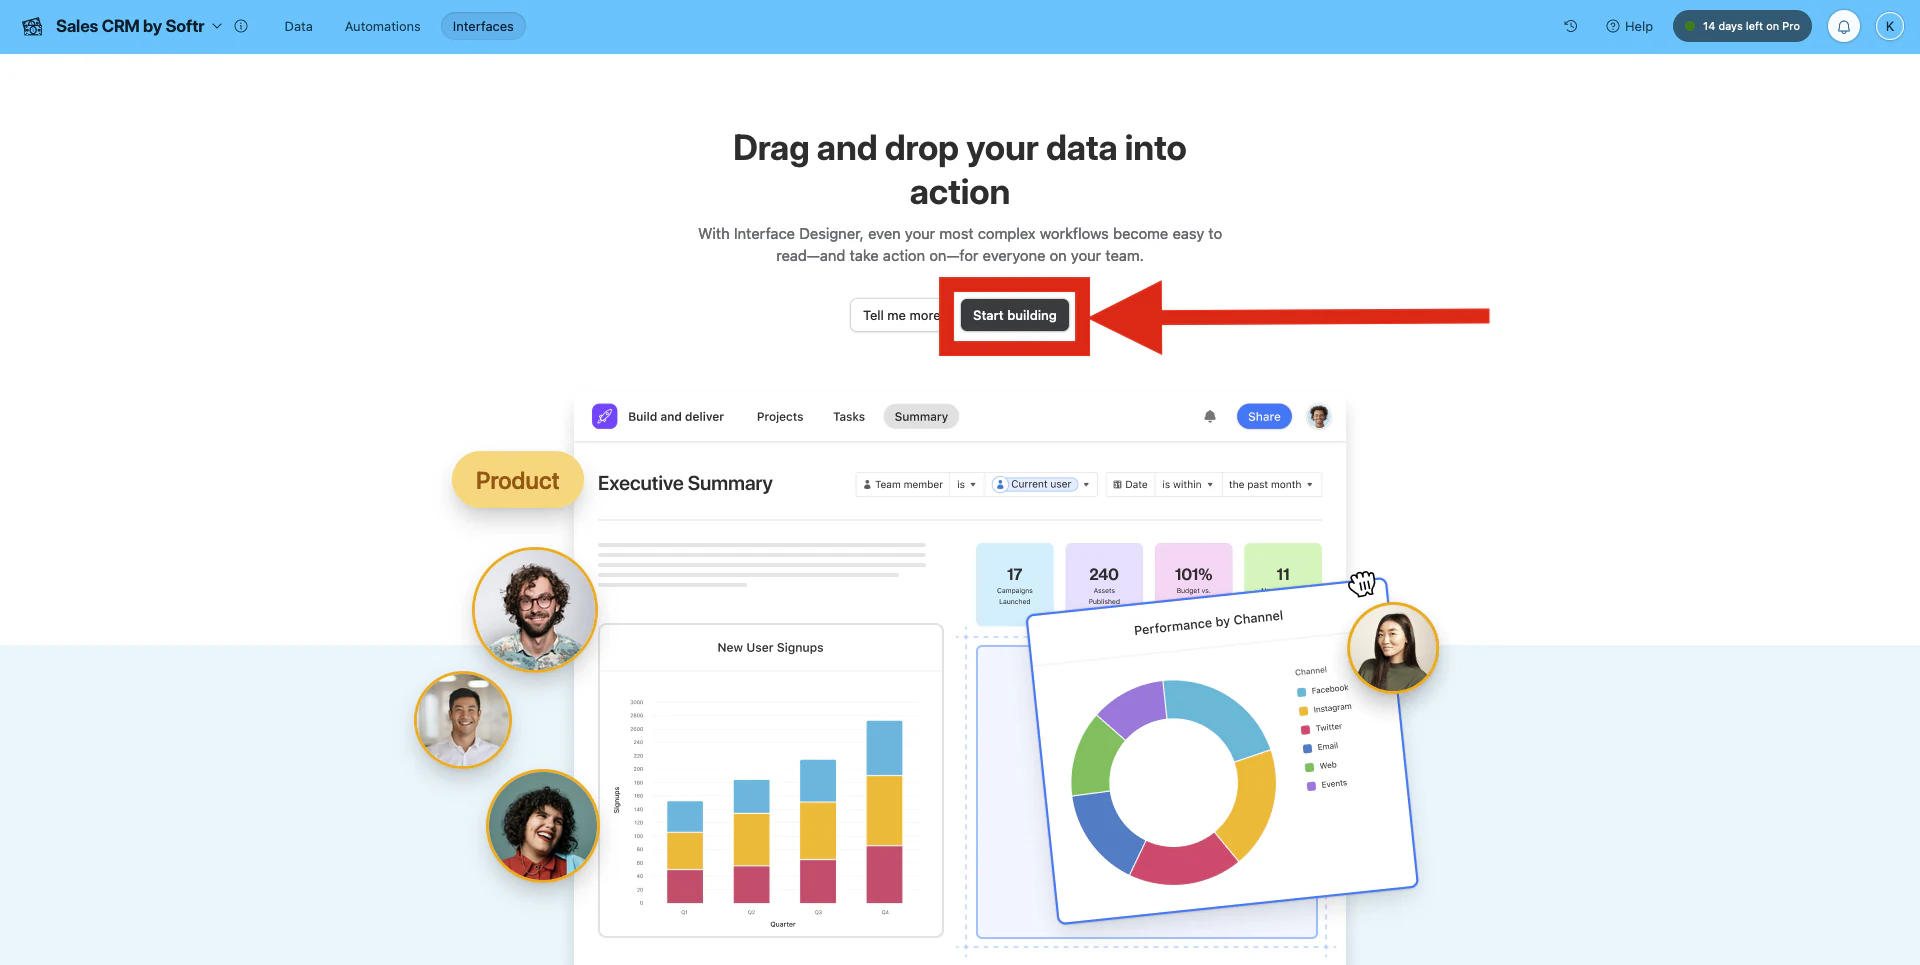
Step 2: Click on “Start building”
On this page, you have the opportunity to learn more about the page designer.
Once you’re ready to create a report, click the “Start building” button.
Step 3: Choose your interface layout
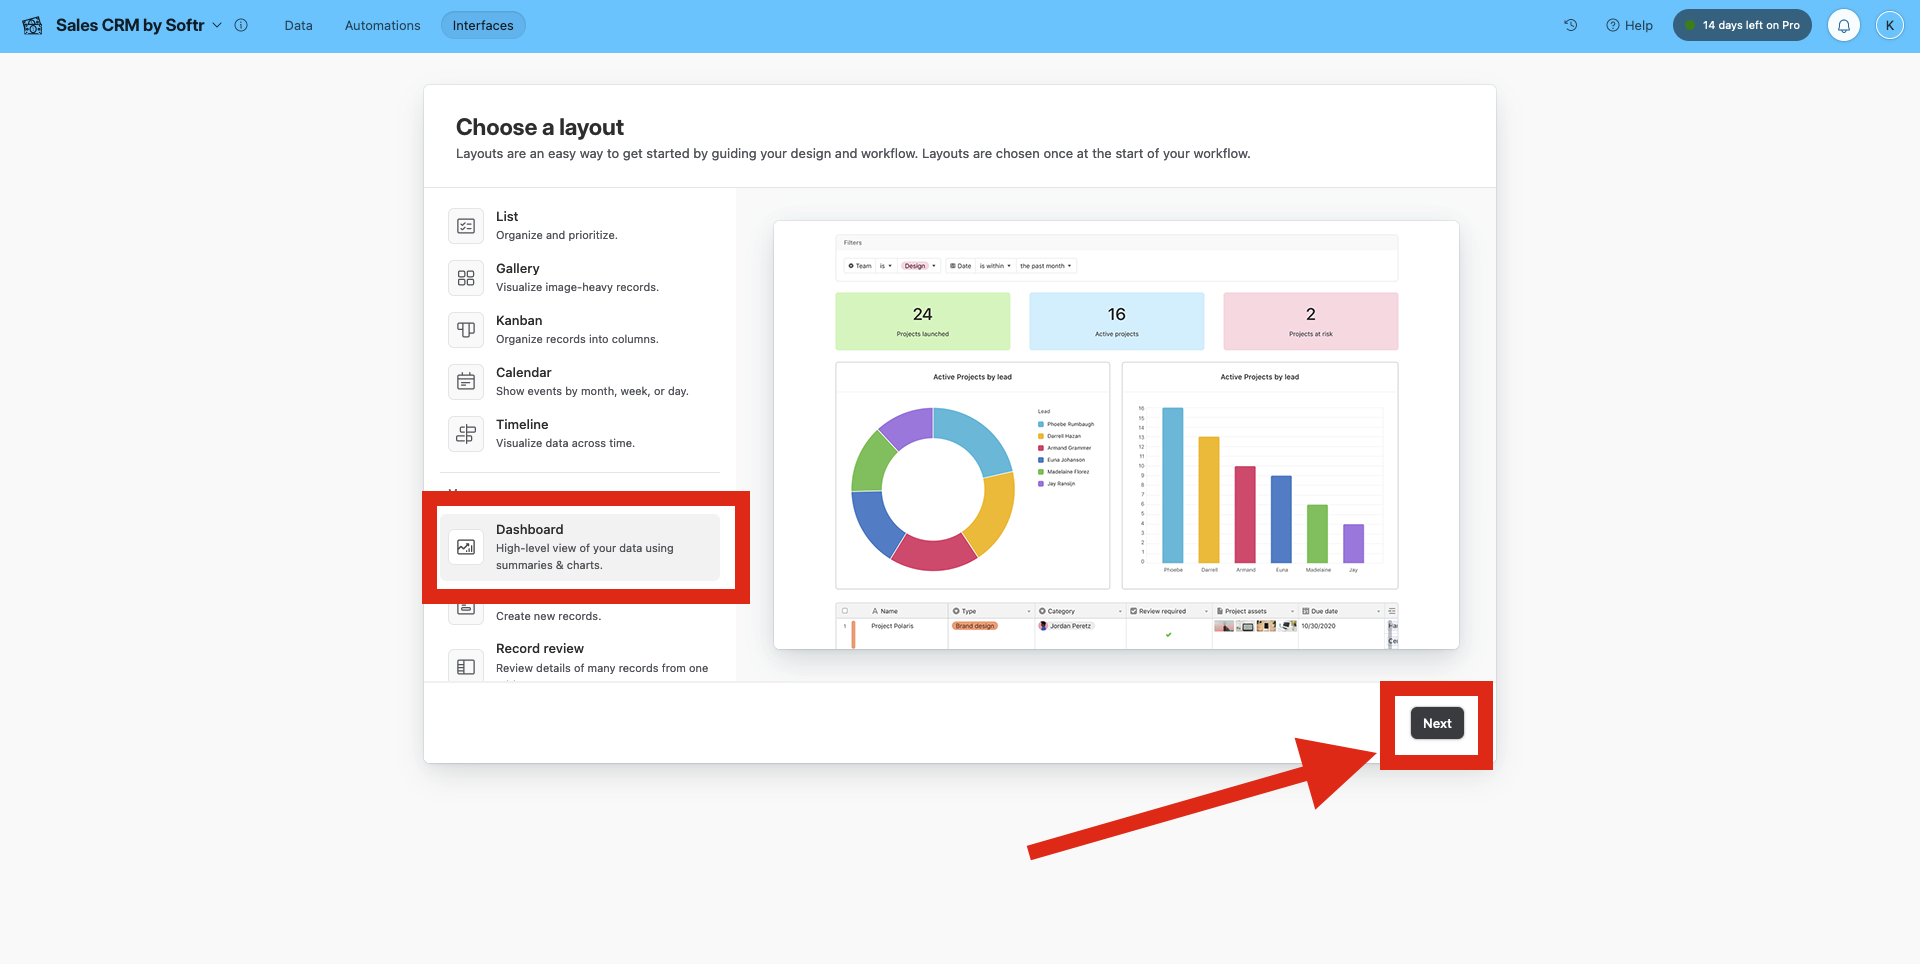
Airtable's page designer offers several layout templates so that you can showcase your current data in the most useful way.
Build an interface page in the app using any of these frameworks:
- Standard list;
- Gallery view;
- Kanban board;
... and more. For a summary report, you likely want to create an insights dashboard. For this example, let’s select “Dashboard” and click “Next”.
Step 4: Connect to a report table
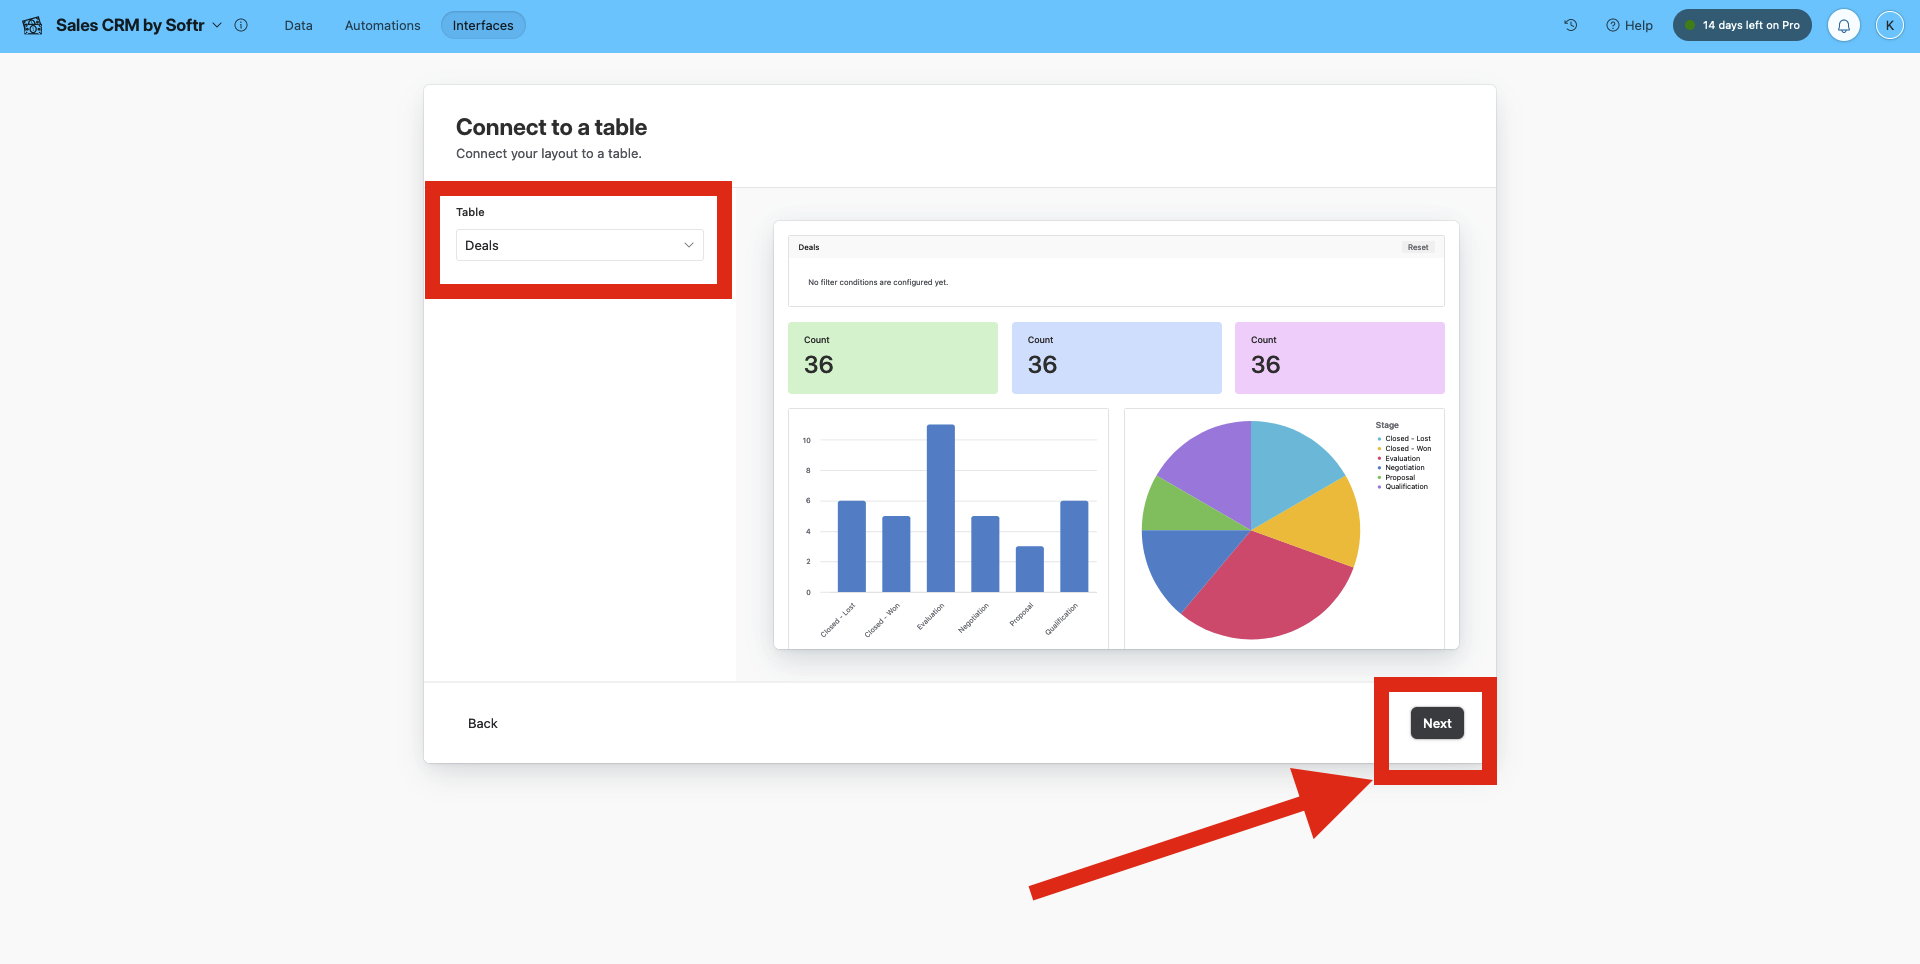
Airtable has an easy to use data fetcher that pulls from any existing data.
Select a report table from your base as a data source for your report, then press “Next”.
Step 5: Add elements to your report
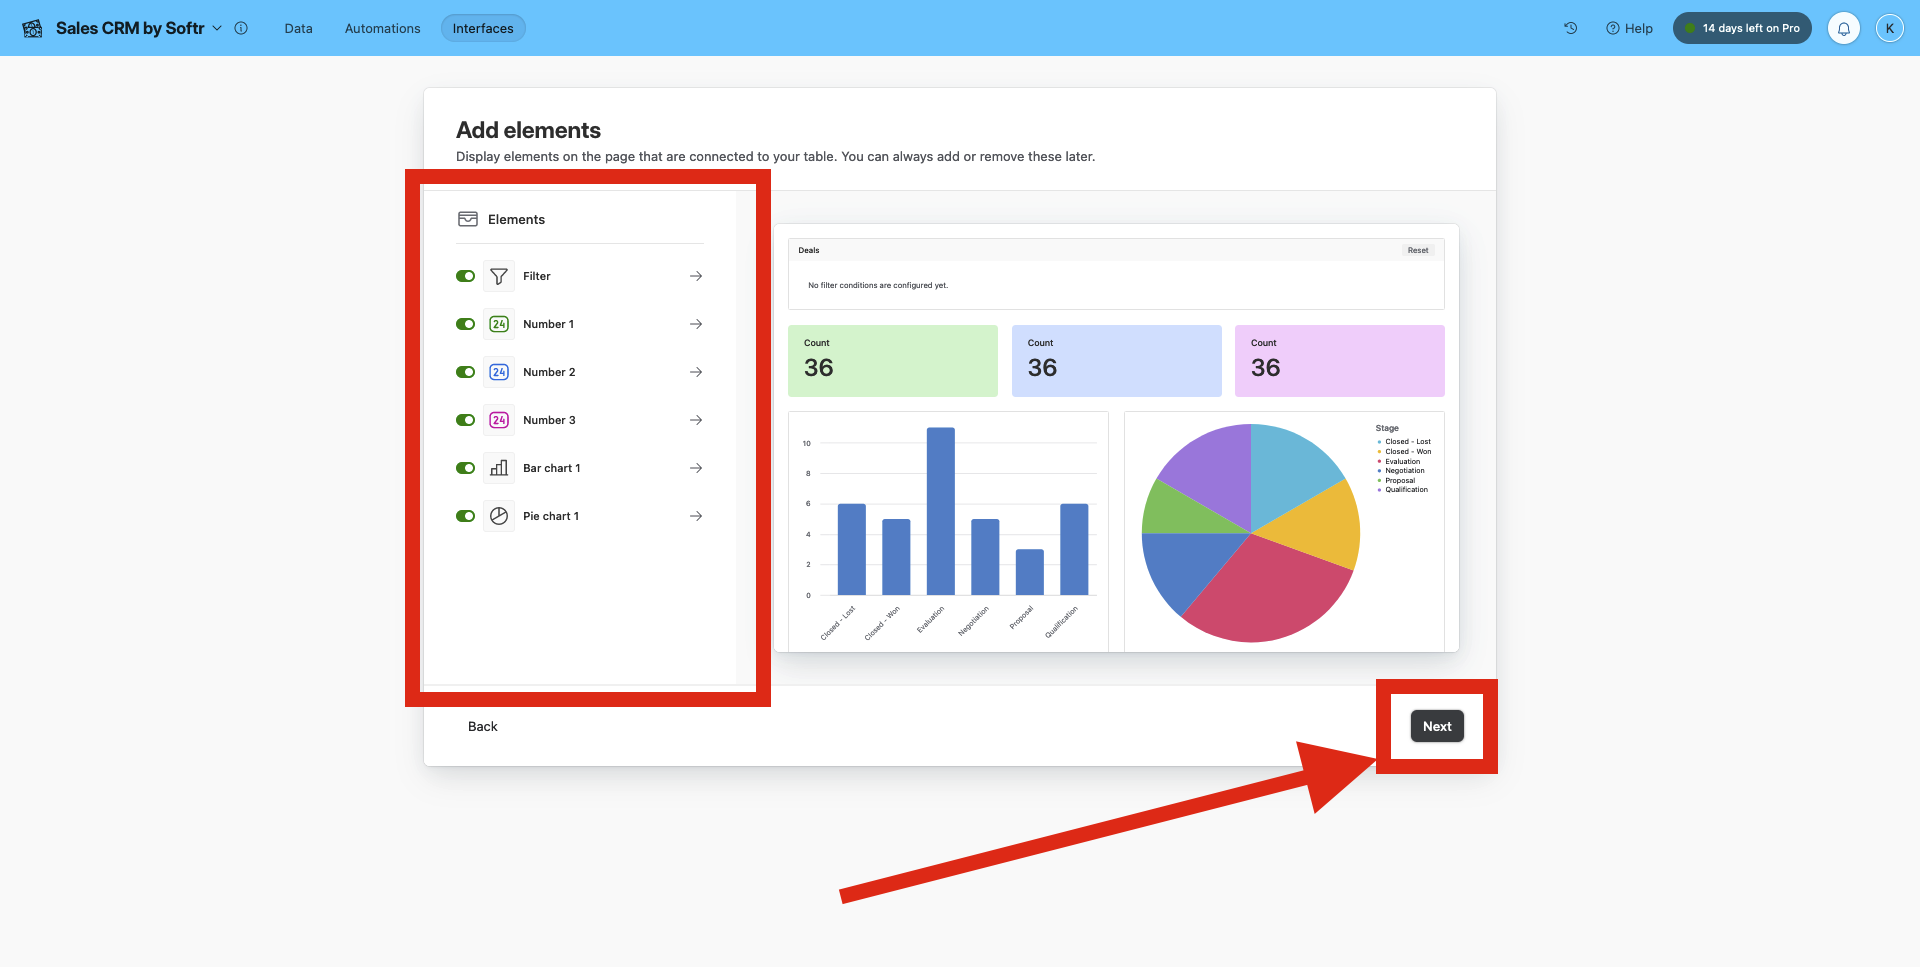
Use the page designer to select elements from the list that you want to display. In this section, you can:
- Insert powerful charts (e.g., a pie chart, bar chart, and more);
- Add filters and conditions to the displayed data;
- Customize the color and font size;
Don't worry if you don't get everything exactly right here. With the page designer, you can create reports and then modify them later on.
Once you’re happy with this first version, click on “Next.”
Step 6: Name your report
Enter your report name in the “Name” field, and press “Finish” to complete the setup!

Step 7: Customize your Airtable Interface Designer report
You now have the first version of your report based on the setup steps we just completed.
Customization in the page designer is relatively easy, thanks to a drag-and-drop interface that doesn’t require technical skills.
To learn how to customize your interface, check out the following steps.
Step 7.1: Add new elements to your report
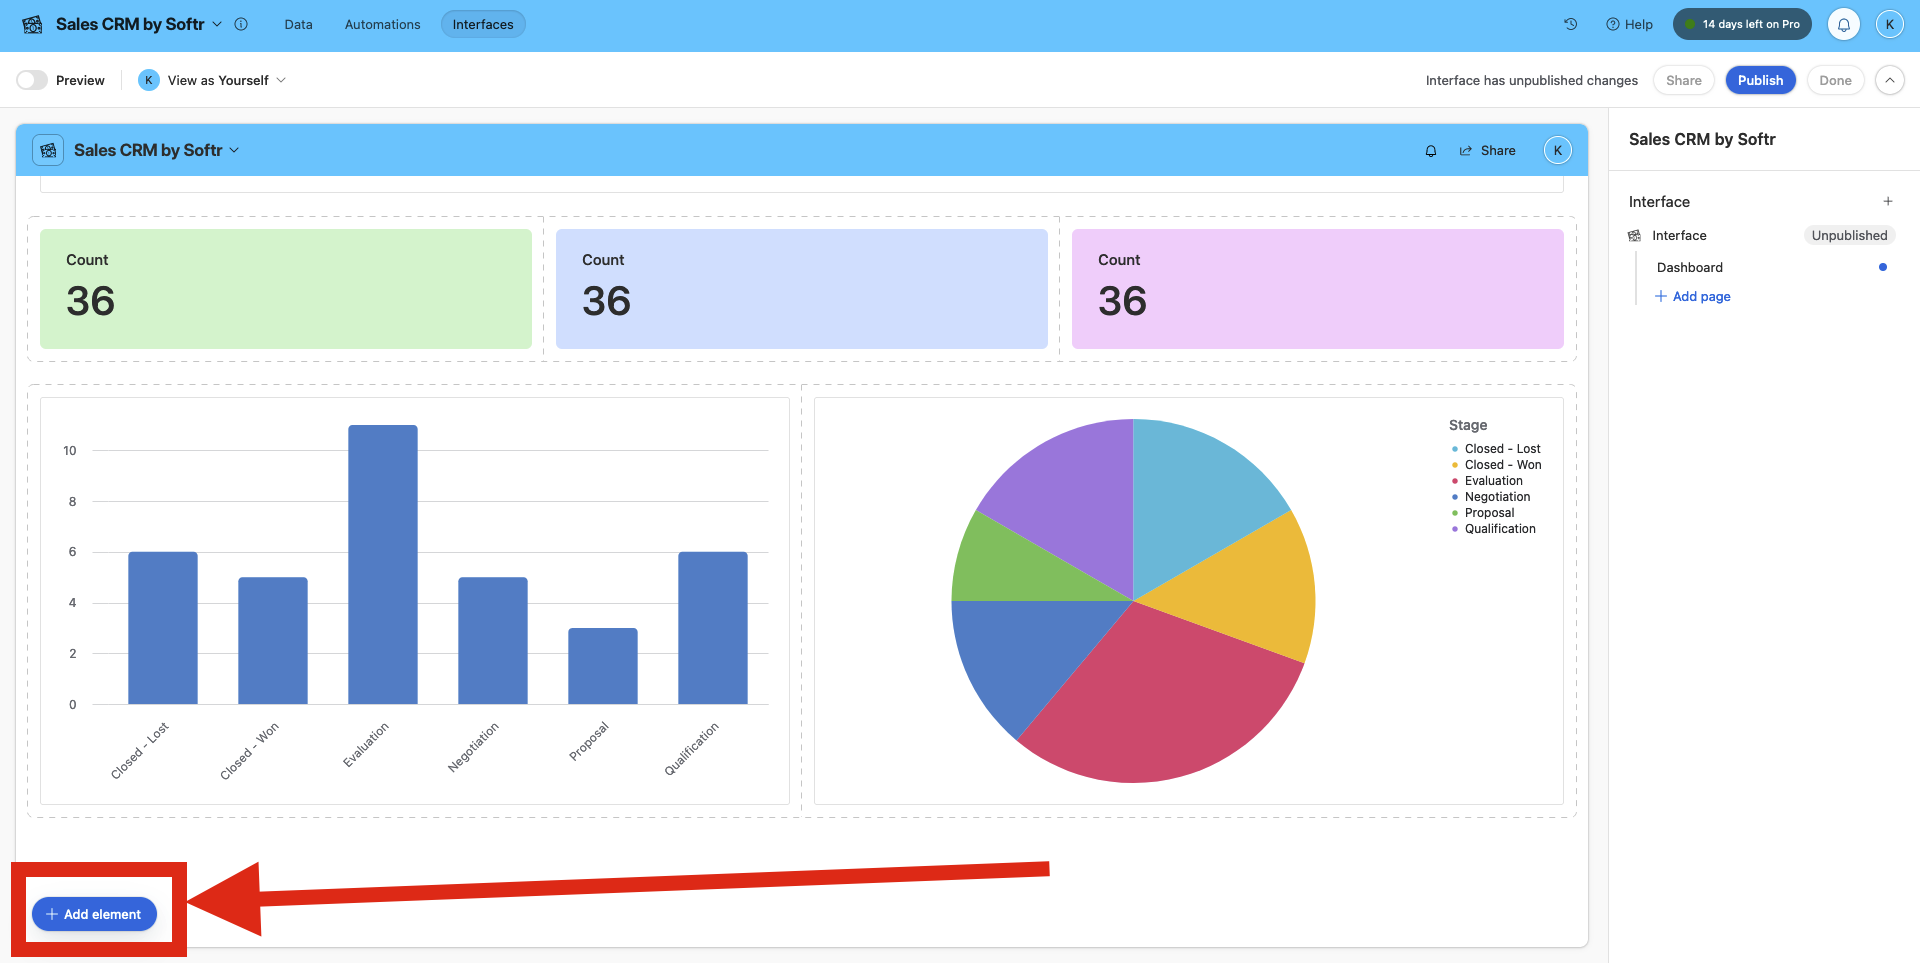
Add new elements to your report by clicking on the “+ Add element” button in the bottom-left corner of your interface.
From there, you’ll be able to customize the color and add various elements like:
- Text and font size;
- Dividers;
- Buttons;
- Numbers;
- Filters and conditions.
Step 7.2: Add a page to your interface
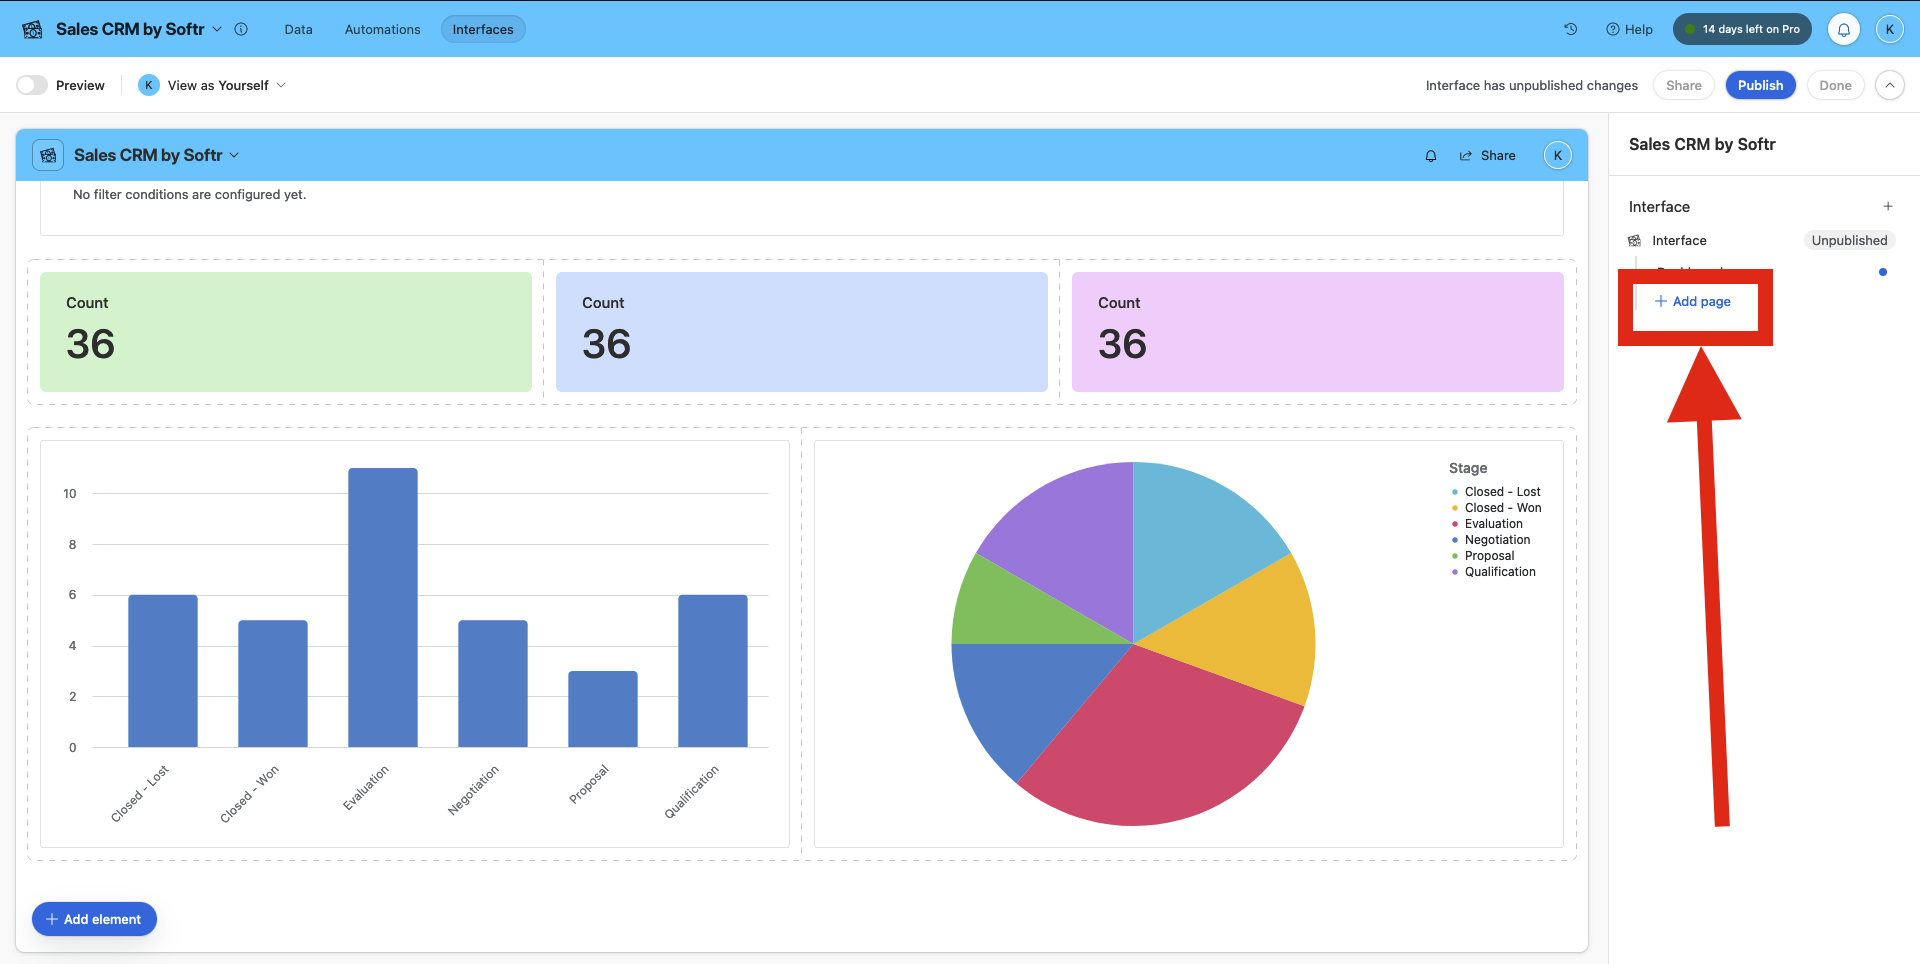
Click on “Add page” in the screen's right panel to add another page to your interface.
This will take you to the same setup process that you started with.
Step 7.3: Preview your report
Click the “Preview” button in the top-left corner to see what your published report will look like.
Note that when you share reports with a free Airtable account, you're also publishing the raw data.

Step 8: Click on “Publish”
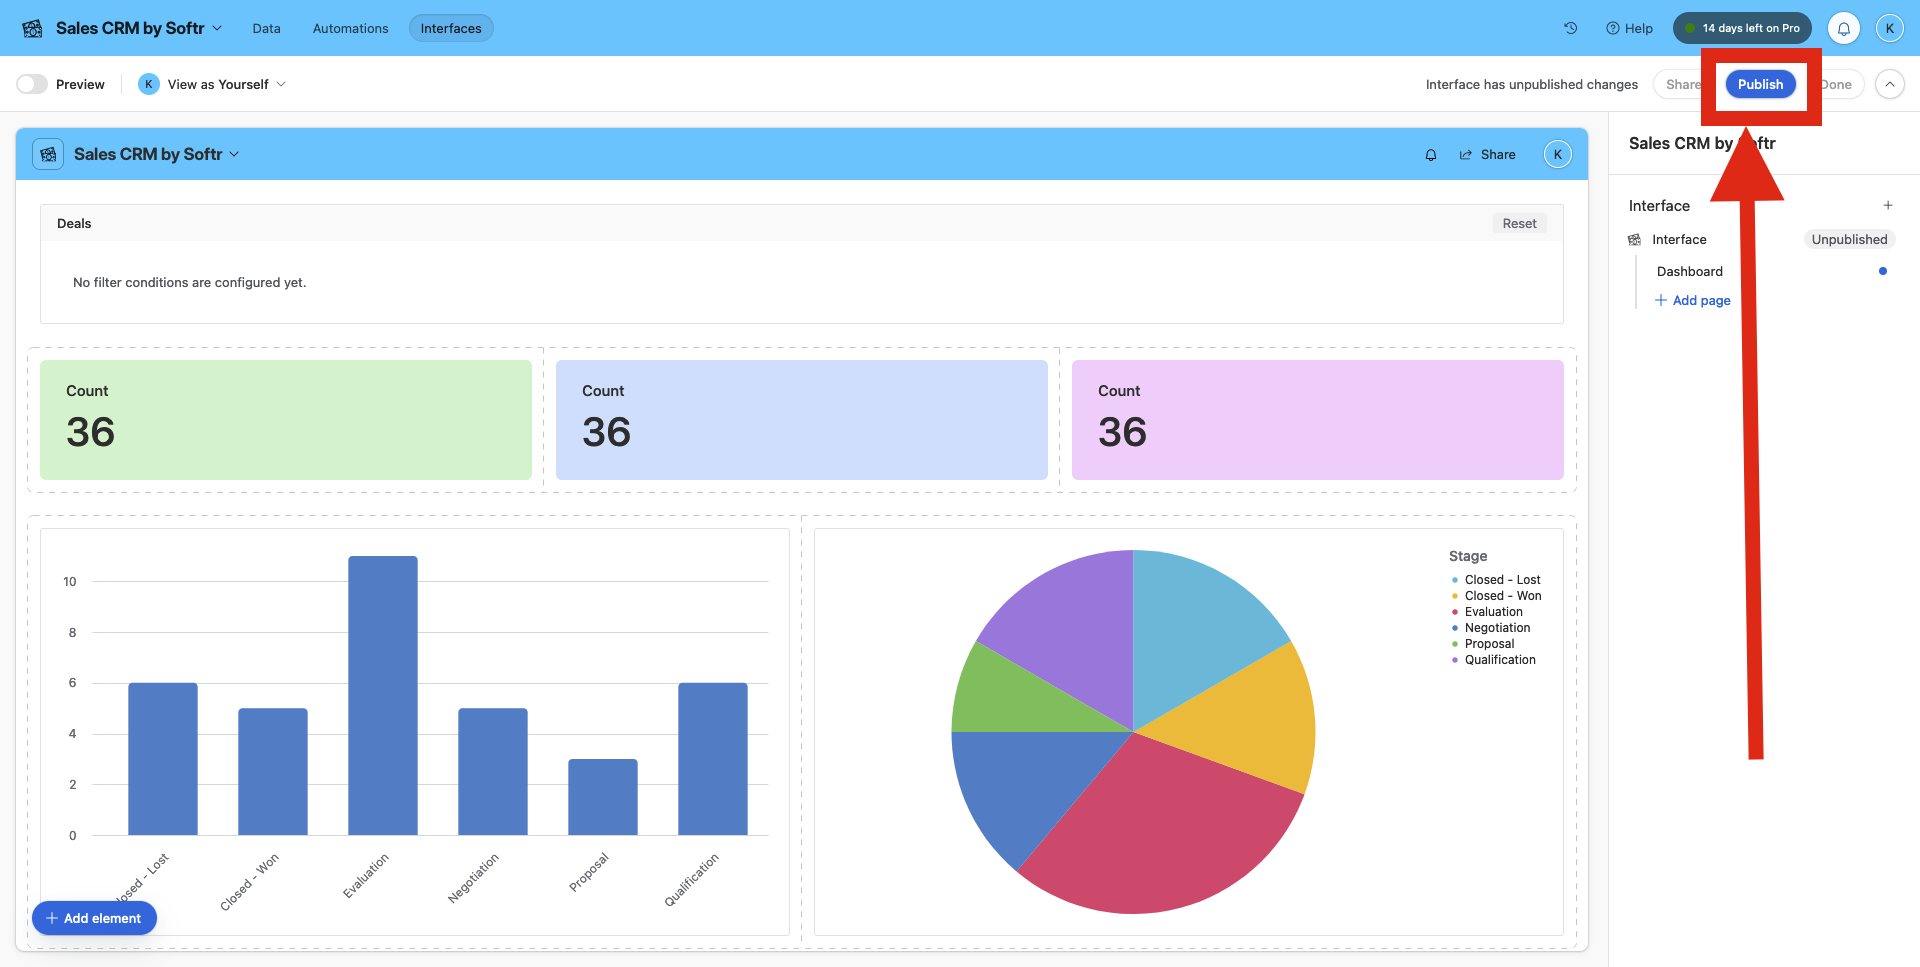
Once you’re happy with your report, hit the “Publish” button on the top-right corner!
If you want to send the interface to team members, you'll also have the option to "share report" via link or email.
One of the biggest concerns users raise about the Interface Designer as a reporting tool is its limited permissions and access levels. Sharing an interface built on a free Airtable plan also exposes the raw records behind it, and Airtable's per-seat pricing gets expensive fast once you need to give access to more than a handful of people.
If access control and cost are a dealbreaker, we recommend building your report table in Softr instead.
Creating a report for your Airtable data using Softr
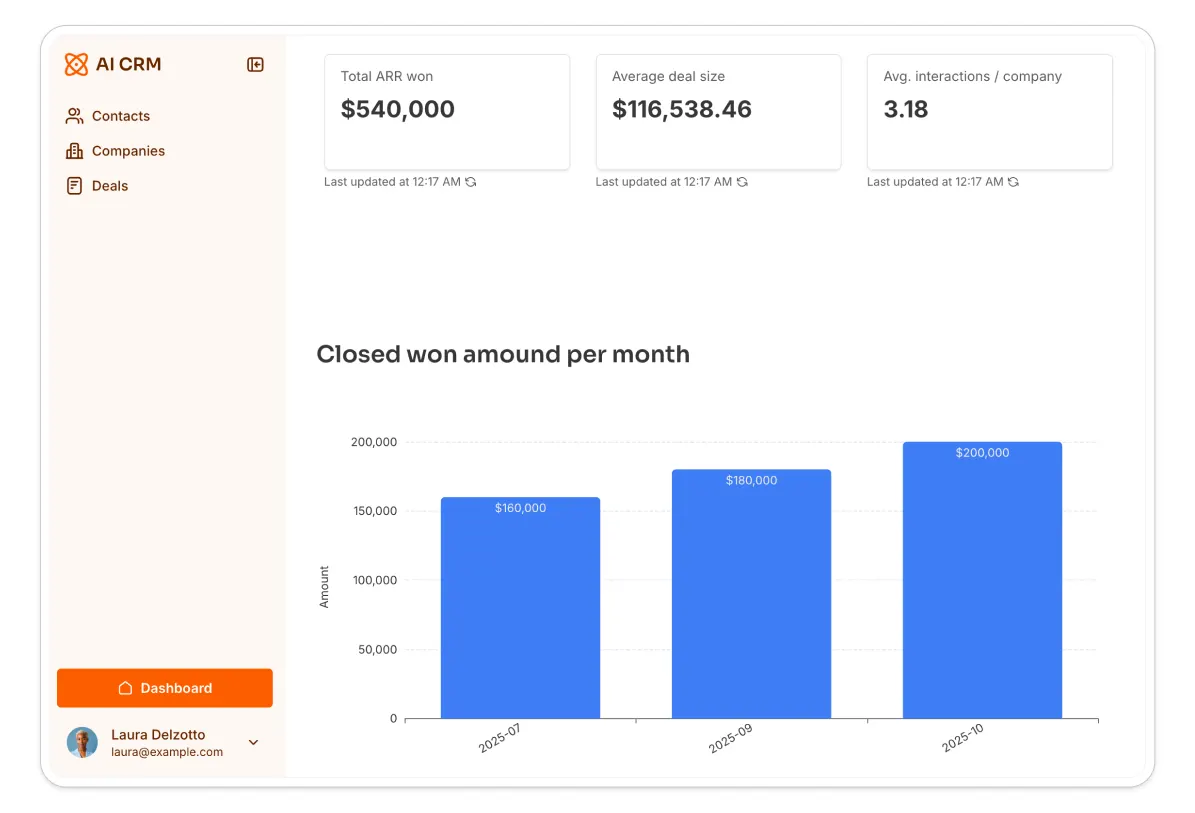
Softr builds on top of Airtable's core functionality so you can create and customize report views for internal and external stakeholders alike.
Unlike Airtable's Interface Designer, Softr lets you share a report publicly, or with specific people, without putting your raw data at risk. Access is controlled through user groups and permissions, and your users can authenticate using:
- SSO;
- SMS;
- Google sign-in;
- Email with a one-time code or password.
This is the same setup FUGA, a music distribution and marketing agency, used to replace static PDF reports with live dashboards for their record label clients: real-time Airtable and BigQuery data, filtered so each client only sees their own numbers. As their team put it, "we really appreciate how we can set user-specific visibility, clients see only what they need to see, nothing more."
Why use Softr as your report extension
Softr is an AI app builder that turns your Airtable data into a full interface for any use case, not just reports:
- Client and partner portals;
- Internal project management tools;
- Dashboards for internal or external stakeholders;
- Standalone reports, which is what we'll build below.
The whole process takes about 10 minutes and is free on Softr's free plan. Rather than start from a blank page, you can describe what you need to Softr's AI Co-Builder and let it generate a first version of your dashboard, or pick a ready-made template and customize it visually from there.
How to create an Airtable report with Softr
Step 1: Log in to Softr
Create a free account or log in to your Softr account using your credentials or Google.

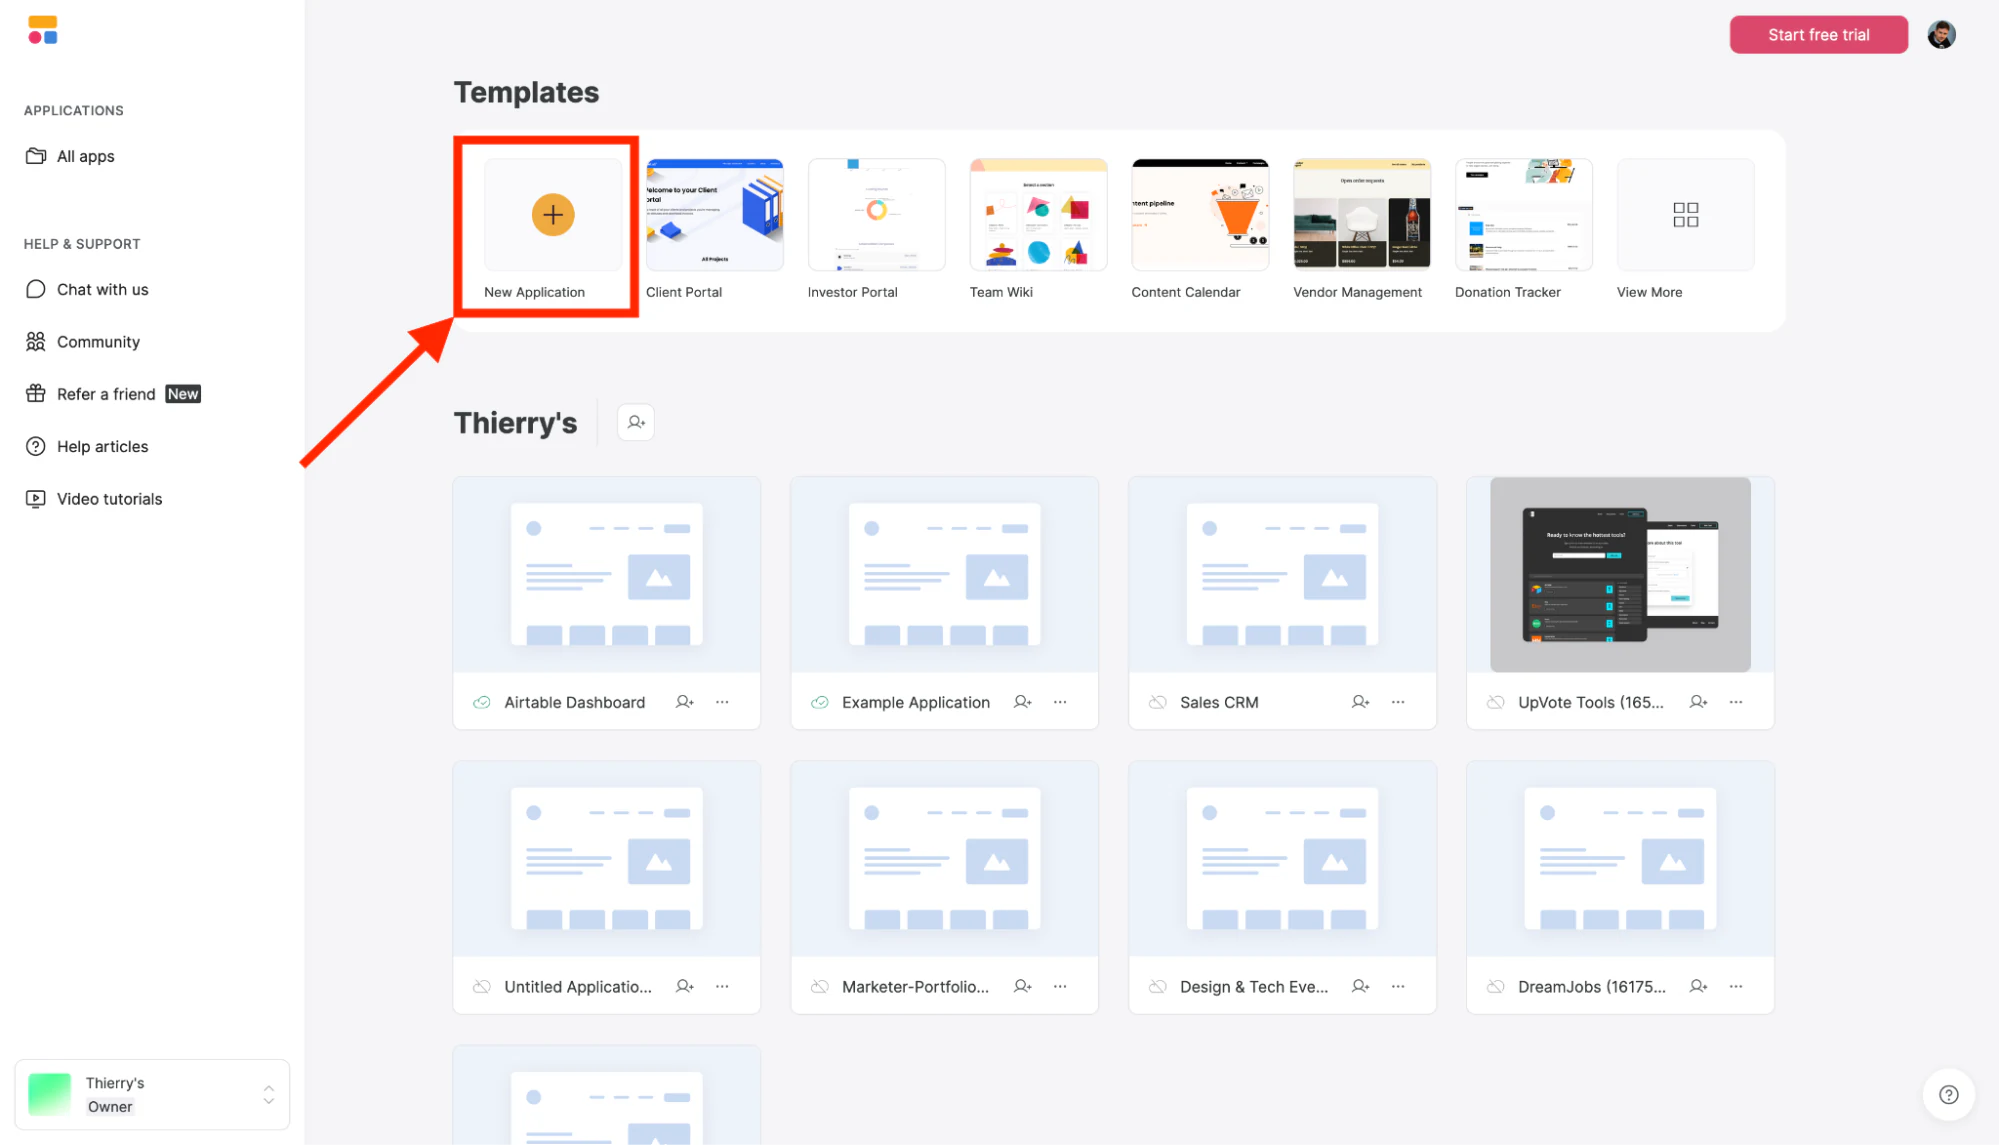
Step 2: Click on “New application”
The first step is to create an application on Softr. Click "New Application" to get started.
From here, you can describe your report to the AI Co-Builder and let it generate a first draft of the dashboard for you, or pick a template to start from an existing Airtable base and matching Softr app. For this example, we'll start with a template.
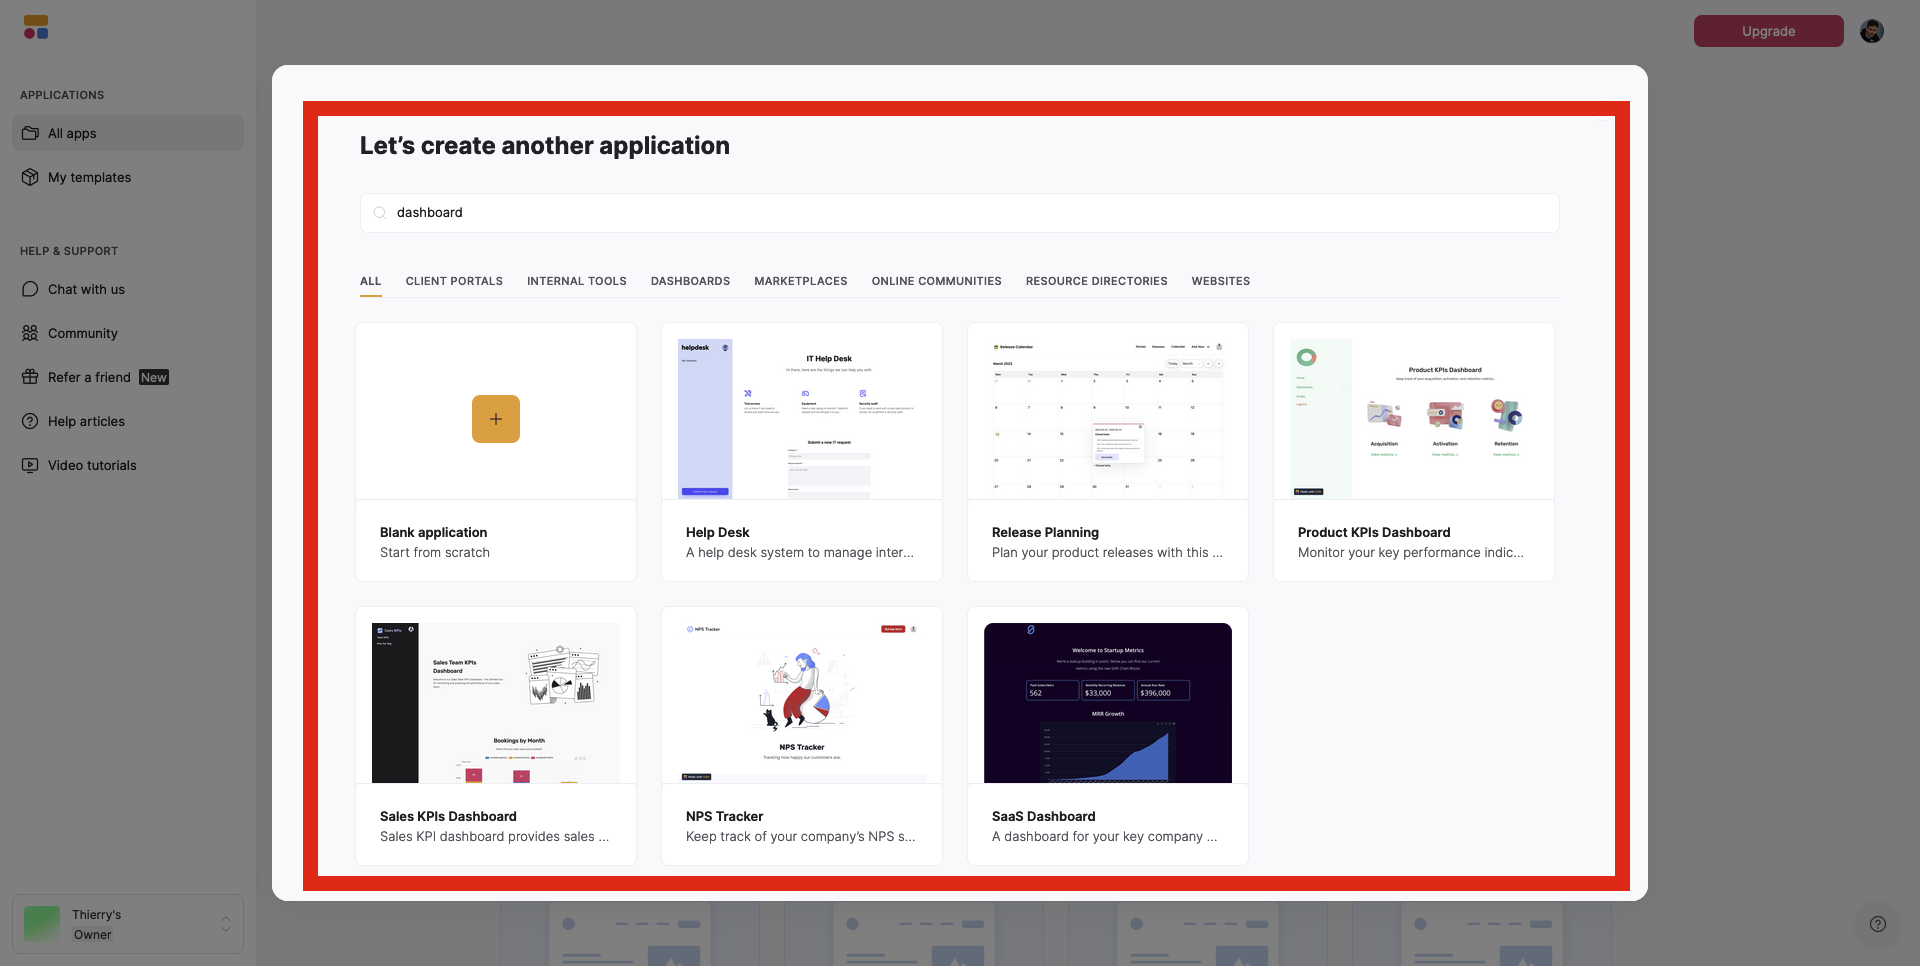
Step 3: Select a template
You can use the “search” field or browse the available templates.
For this example, we chose to use the Sales KPIs Dashboard.
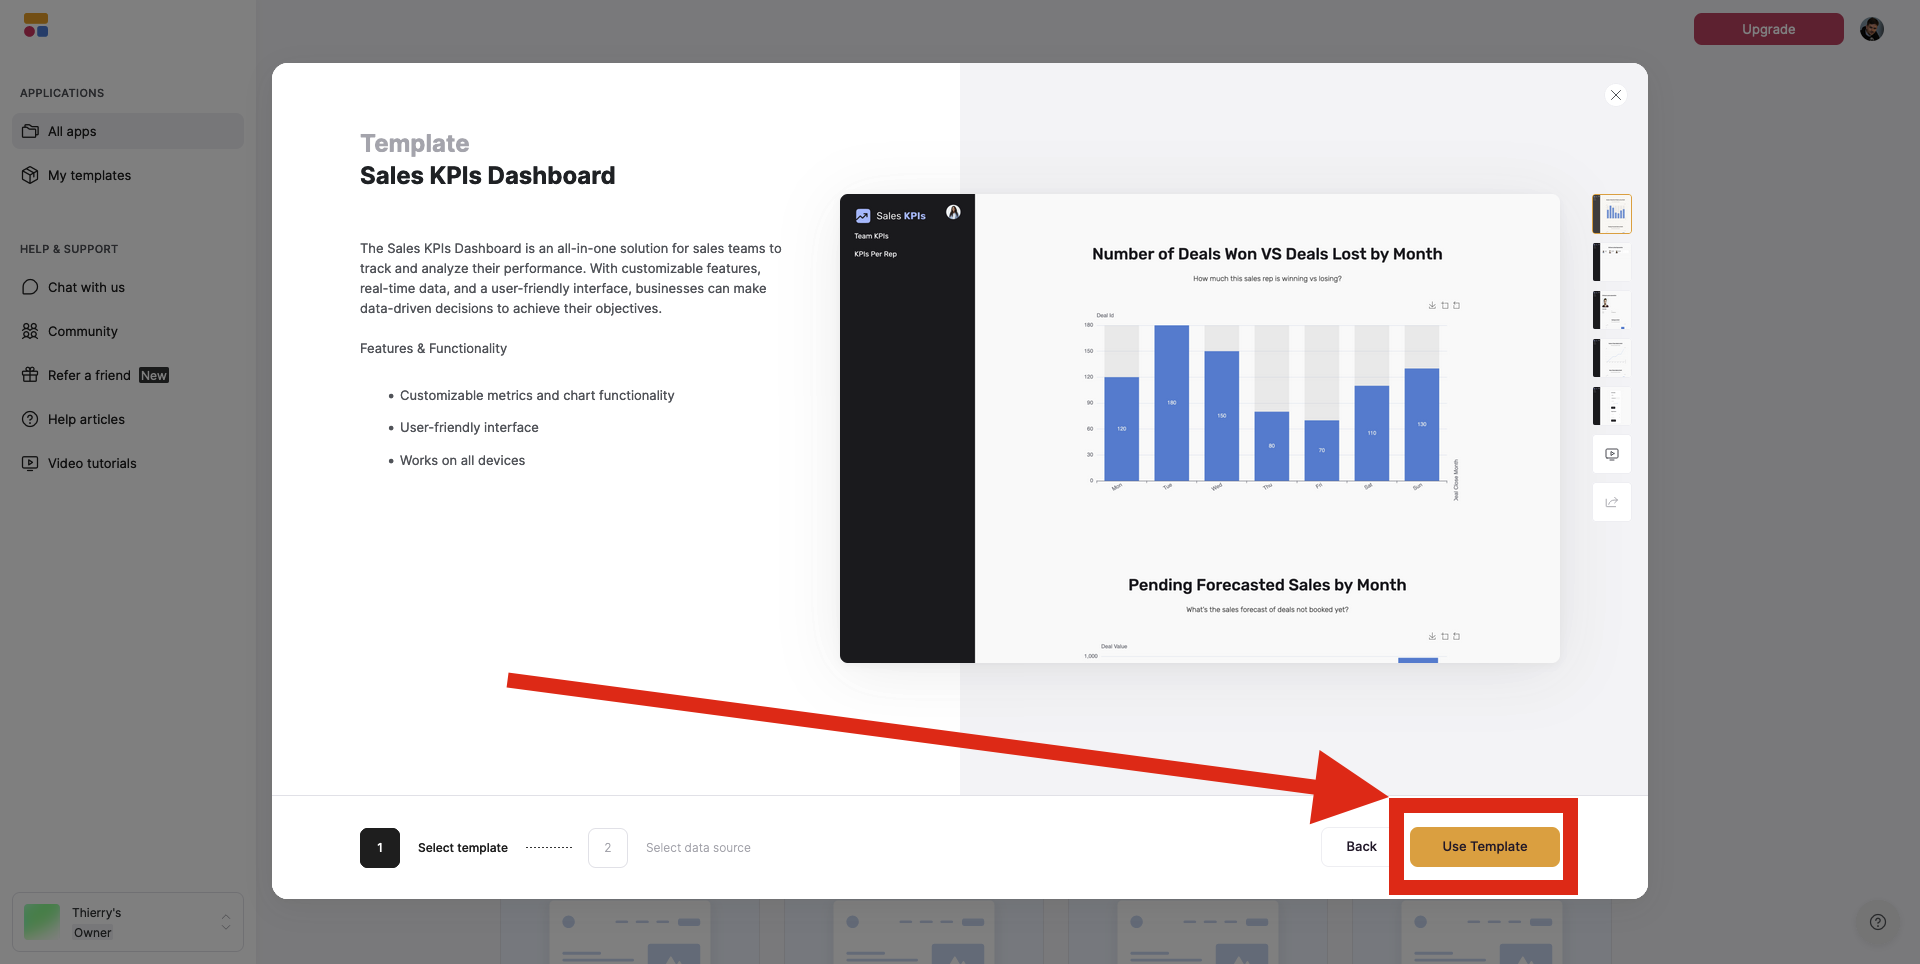
Step 4: Click on “Use Template”
Let’s get started with our template.
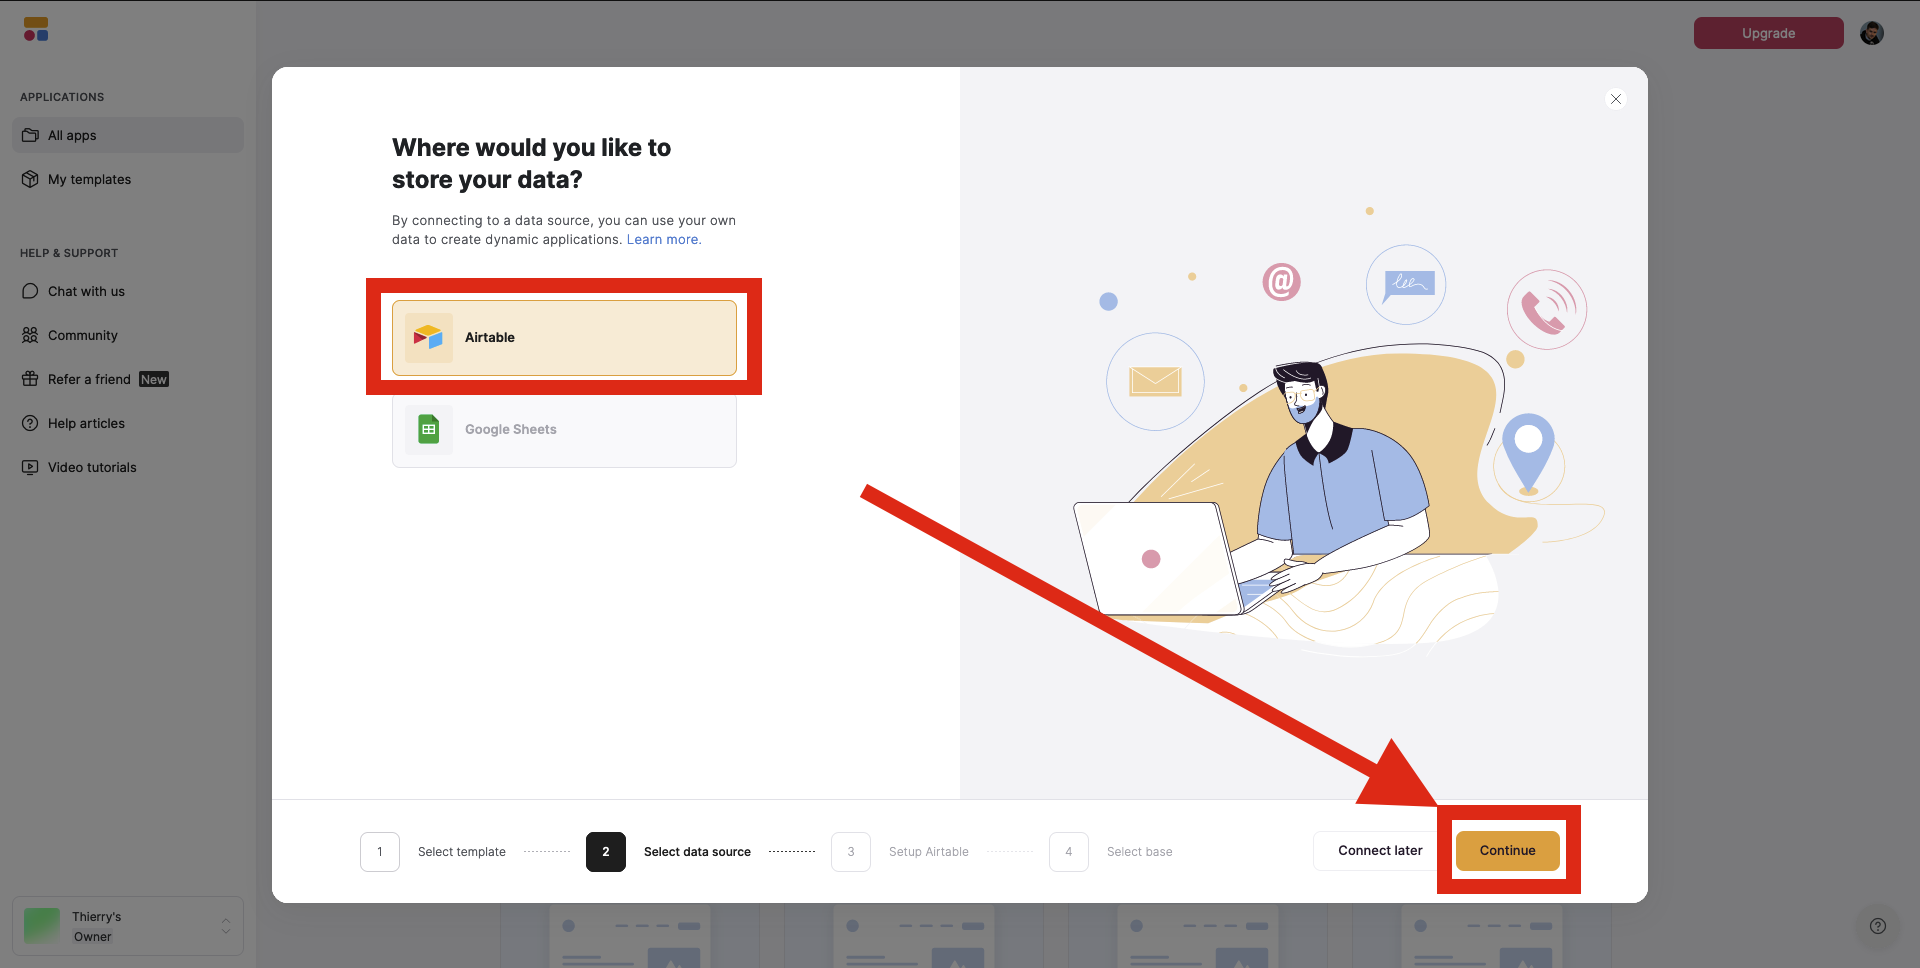
Step 5: Click on “Airtable” as your data source
To link the chart extension with your Airtable data, select Airtable as your data source. (Note: If you need even higher performance or want to build without third-party API rate limits, you can also use Softr's native databases as your data source instead).
Step 6: Choose your authentication method
You have the choice between using a personal access token or your API key.

Step 7: Click on “Copy base to your Airtable account”
Let's copy this base on our Airtable account.
This will redirect you to Airtable, where you can click “Add base” to complete the initial setup process.

Step 8: Your report is now synced with Airtable data
Changes in the Airtable data will be reflected in your new report.

Step 9: Customize your report
There are plenty of things you can do on Softr to further customize your new report.
Check out the following steps.
Step 9.1: Add new blocks to your report
Your report can be customized with entirely new blocks, either dynamic or static, including:
- Forms;
- Lists;
- Tables;
- Charts;
- Kanban boards;
... and more.
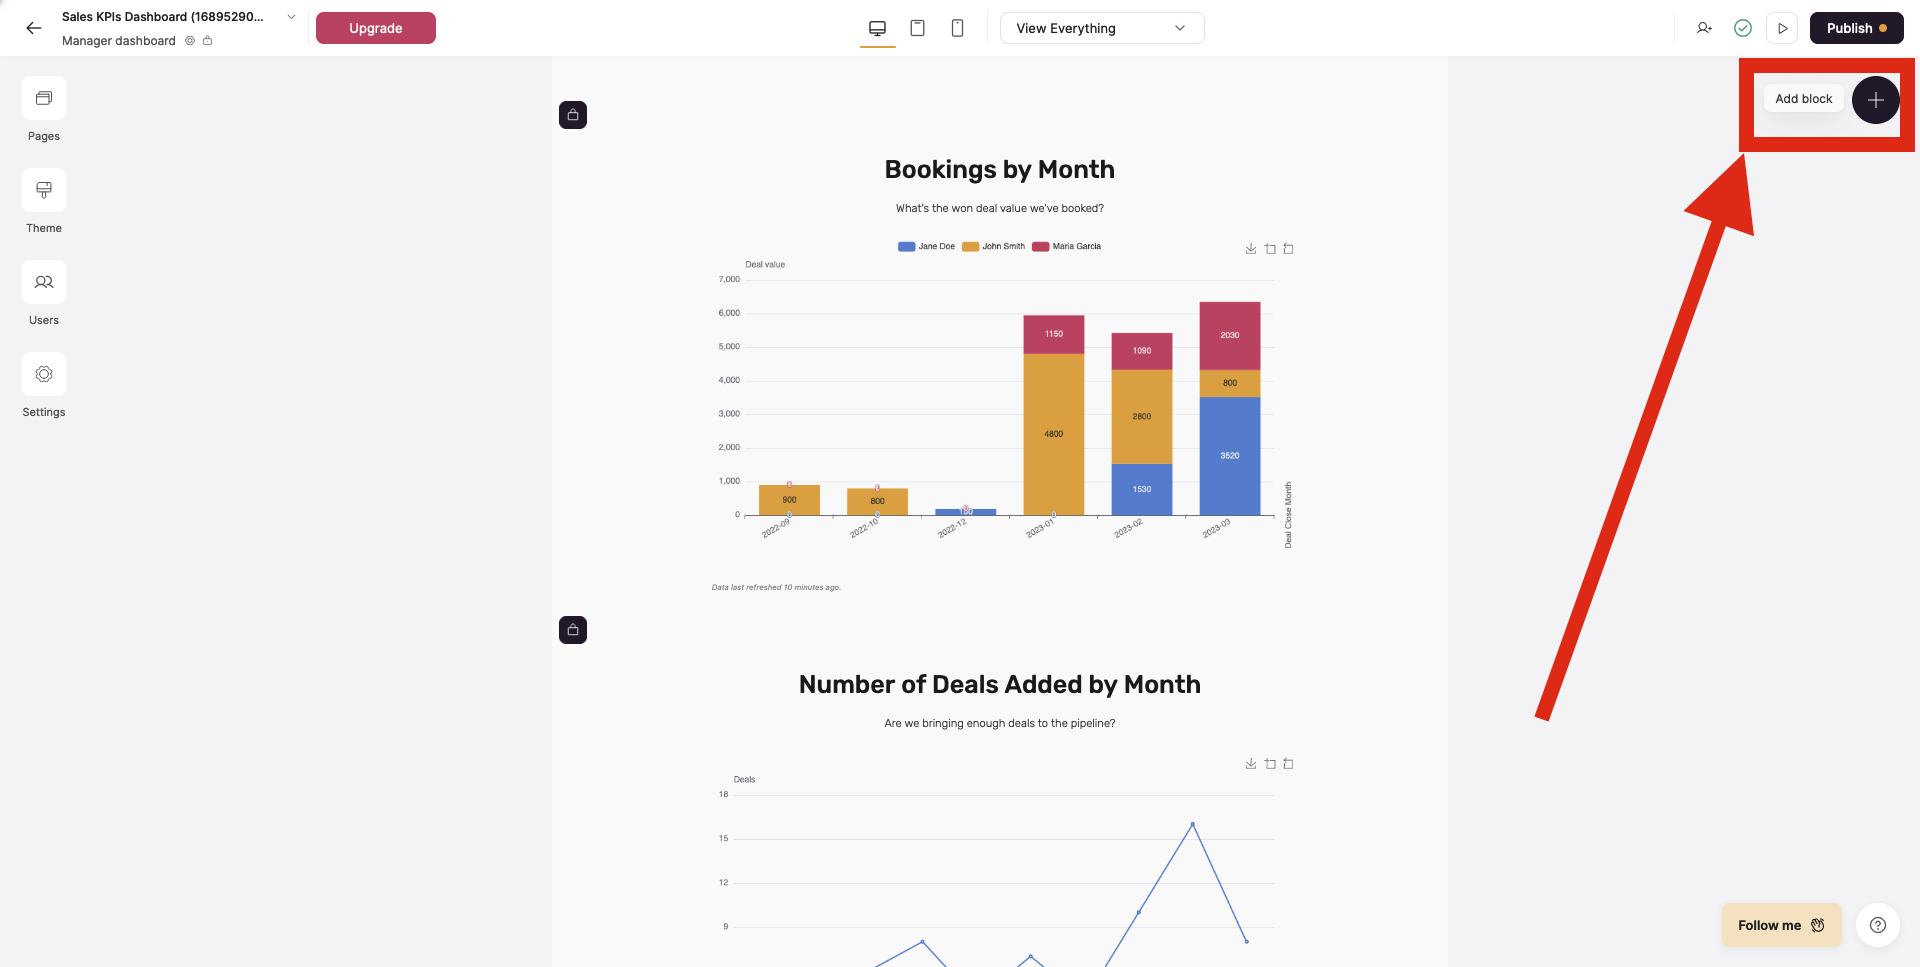
To do so, click on “Add block” and select which block you want to add, or describe the block you need to the AI Co-Builder and let it add and configure it for you.
Step 9.2: Set permissions for each block
This is one major way Softr's advanced access levels can help you.
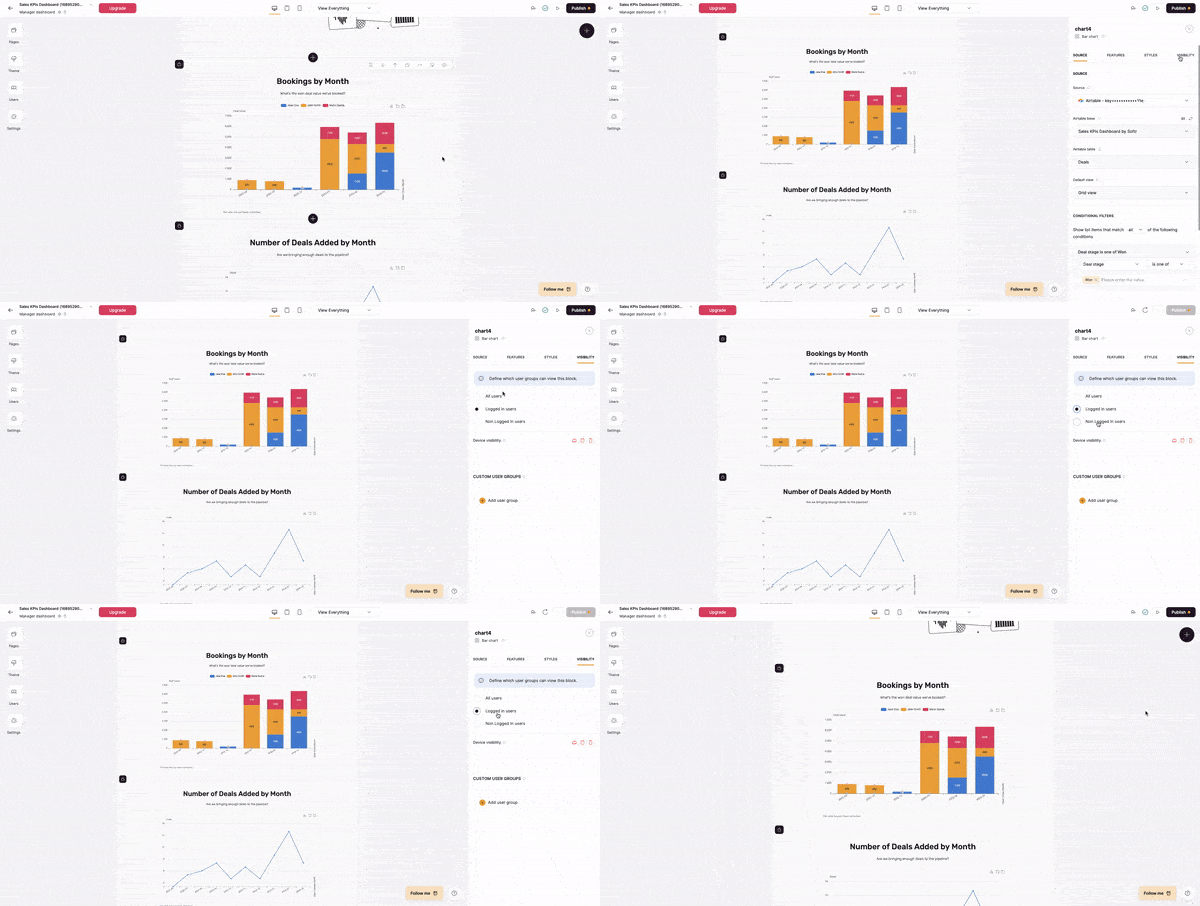
By clicking on individual blocks and selecting the “visibility” tab, you are able to determine who should be able to see the content of that bloc.
This is particularly useful for sensitive information for example.
Step 9.3: When ready, click on “Publish” to set your report live
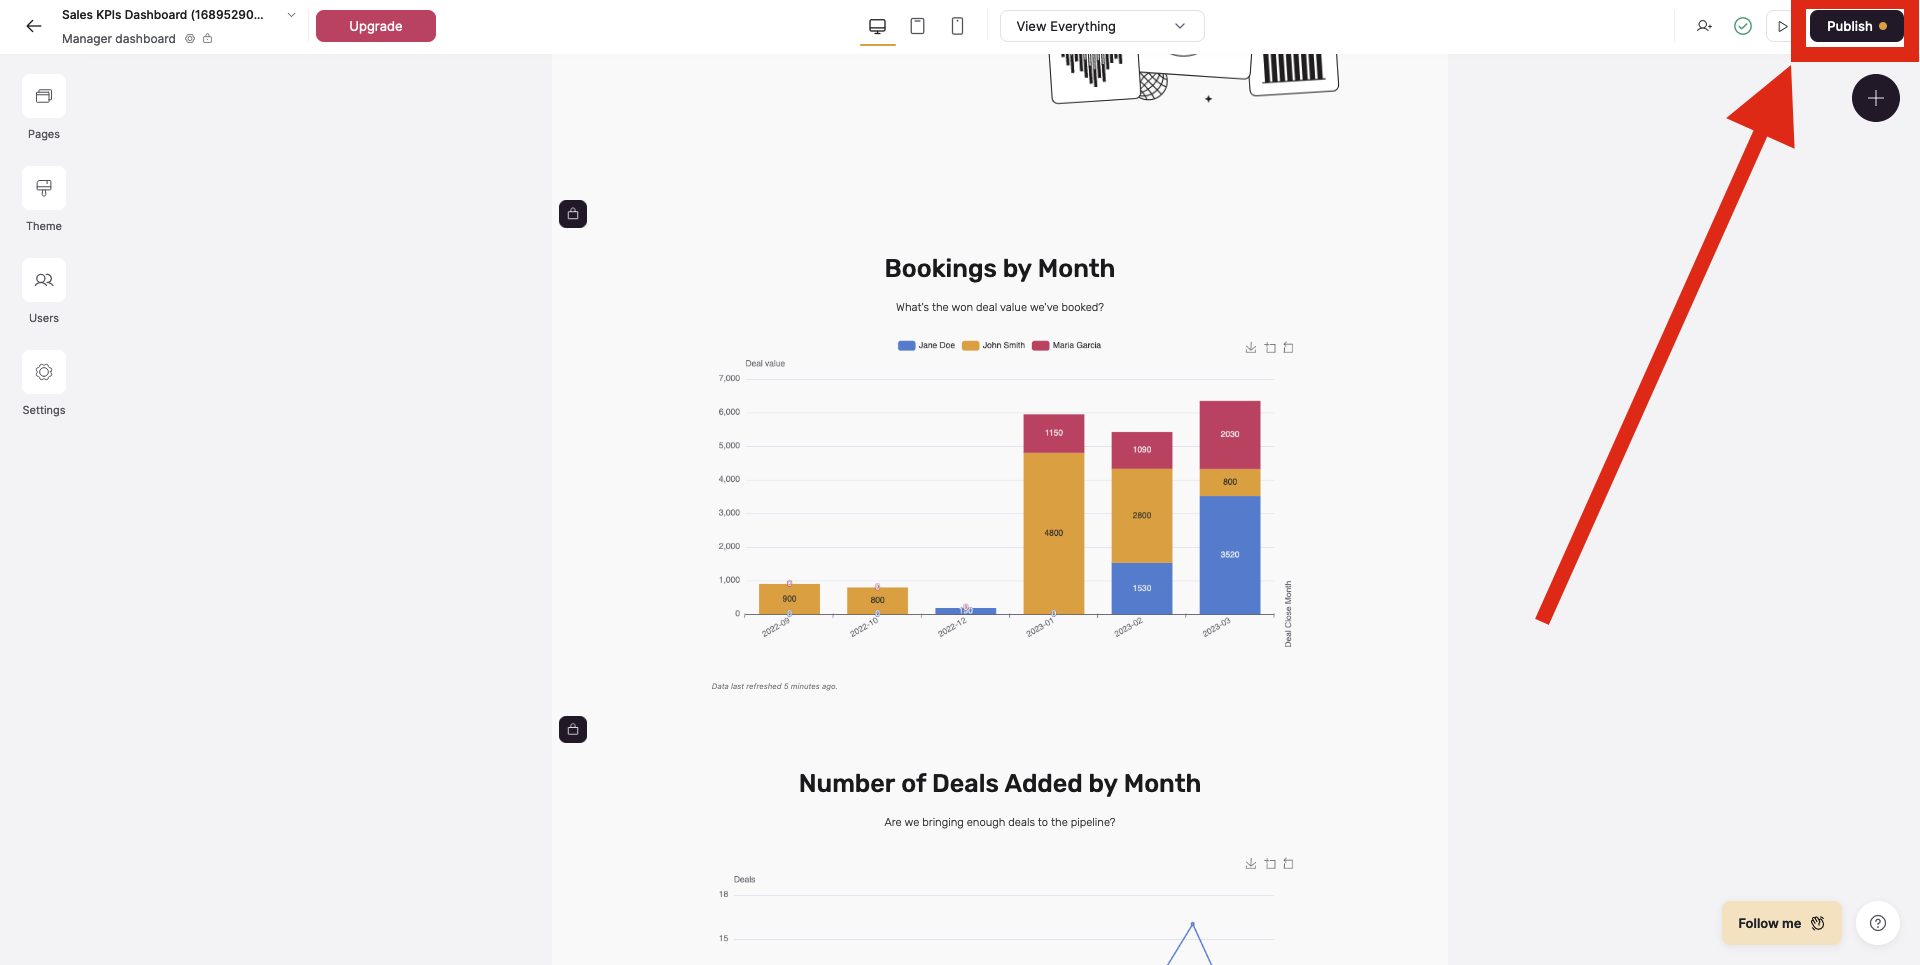
Whenever you’re ready to set your report live into the world, click on “Publish," set your customer domain and/or subdomain and hit “Publish” again.
Turn your Airtable base into a report stakeholders actually use
A custom report is what turns scattered Airtable records into something your team can act on: trends spotted early, progress tracked without digging, and numbers leadership can read in seconds.
Airtable's Interface Designer gets you a basic version of this for free. If you need tighter permissions, external sharing, or a report that lives alongside portals, forms, and workflows in the same app, building it in Softr on top of your Airtable data gets you there without adding per-seat costs.
Frequently asked questions
Can I create a report in Airtable for free?
What's the difference between an Airtable Interface and a Softr report?
Can I share an Airtable report without exposing my raw data?
Do I need to rebuild my report every time my Airtable data changes?
What kinds of charts can I add to an Airtable report?