[.blog-callout]
✨TL;DR:
- Google Sheets is great for collecting and analyzing data, but sharing it safely is hard: permissions are coarse, version history exposes old data, and one wrong click can leak sensitive information.
- A GUI (graphical user interface) built on top of your spreadsheet fixes this: your data stays in Google Sheets while users interact with it through a secure, branded business app.
- With Softr, you can describe your app to the AI Co-Builder and get a working interface in minutes, or start from a template or a blank canvas.
[.blog-callout]
I remember sharing a Google Sheet the first time. It was everything I imagined. Collaboration was seamless, every stakeholder was kept in the loop, and it was a fantastic tool. Using it felt like magic. After all, Google Sheets is easy to use, versatile, user-friendly, accessible, and integrates seamlessly with other Google services.
However, as the spreadsheet grew, I realized two things: the amount of sensitive data grew as I built more spreadsheets, and its ease of access was no longer an advantage but a double-edged sword. It made me realize that sharing spreadsheets, or any information in Google Sheets, could swing either way.
And with that realization came a looming concern, or frankly, an important question: "How do I keep all of this information safe?"
Don't get me wrong: Google Sheets is a fantastic tool for collaboration, especially when you're on the go. On the other hand, it also makes protecting sensitive information daunting. For example, many users like myself like the ease that comes with its "sharing permissions" feature. Still, with that ease comes something tricky. Imagine wanting to share a certain document with select stakeholders or teammates. One wrong click and you've immediately given other people access to sensitive information they shouldn't have any business reading or knowing about.
This made me understand that when it comes to protecting sensitive information, using Google Sheets can be likened to trying to lock up a house with doors made of glass. Let's break this down further.
The collaboration dilemma
Hands down, one of the main appeals of Google Sheets is its collaborative feature. This allows you to easily share and access documents with colleagues and stakeholders, thereby enhancing productivity, collaboration, and teamwork. Nonetheless, with this ease of sharing comes another problem: oversharing. As I mentioned earlier, one wrong move and suddenly, sensitive information becomes visible to people who shouldn't see or know about its existence in the first place.
Password protection? Not quite!
Unlike Microsoft Excel, Google Sheets doesn't offer a linear path to password protection. This means sensitive or redacted information is a click away from the wrong eyes or hands. Of course, there are some workarounds like using third-party add-ons (which could also pose security risks as they might expose your data to external threats), encrypting data manually, or using script-based protection platforms like Google Apps Script to create custom protection features for locking cells or sheets.
And yet, I dare say if we're being honest, many of us aren't looking to become coding wizards just to protect our data. All we want to do is find a place that not only keeps our data but protects it and keeps it safe.
Permissions level
Google Sheets offers three different permission levels: Viewer, Commenter, and Editor. Let's imagine that you gave someone access to a Google Sheet. While this is great for collaboration, it also means the other party can delete, modify, or change data. And if you aren't tracking who has what level of access, you might find data missing or changed without even realizing it.
There's another problem operators often forget: shared spreadsheet links don't expire. When a contractor or client relationship ends, their access stays active unless someone remembers to revoke it manually.
Version history
Google Sheets has a built-in version history feature that I consider a lifesaver. It allows you to see and revert to previous versions of your document. Nonetheless, this can quickly become a headache. For instance, if sensitive information is deleted, you can easily restore it. What happens when you aren't careful? Older, unprotected versions might still be accessible to viewers. You end up constantly juggling between keeping data accessible and safe.
Data encryption and security
While Google encrypts data on the go, it still relies on user behavior to achieve optimum security. Therefore, this means you need to educate team members and other stakeholders involved about the importance of using strong passwords and two-factor authentication. However, note that not everyone is tech-savvy (or wants to be) and a simple, single mistake can result in a data breach.
The human element
Perhaps the biggest challenge with sensitive data protection might not be Google Sheets itself, but the human factor. Google Sheets offers us convenience, and sometimes in our rush to collaborate (while juggling other tasks), we forget or underestimate the importance of security measures like malware scanning. It's easy for someone to share a document using simple passwords because they are easy to remember, or to overlook who really needs access.
A common workaround is to copy the sheet, manually delete the rows the recipient shouldn't see, and email the file. The workflow is error-prone: one missed row exposes confidential data. A proper interface with database-level row filters automates the same outcome with no manual intervention and no exposure risk.
With all the loopholes listed above, you might wonder, "Can I build a dashboard in Google Sheets?"
How do I create a dashboard in Google Sheets?
After deciding on the structure of your dashboard, knowing the story you want it to tell, and identifying the key metrics and KPIs you need, Google Sheets has a range of tools to help visualize your data. We cover the spreadsheet-only approach in detail in our guide to creating a dashboard in Google Sheets.
There's the "Insert Chart" function that allows you to select chart types that best represent your data. Conditional formatting is also another feature that helps you highlight important data points. For example, creating rules to change cell colors based on their accompanying values can help spot outliers, trends, and other key thresholds.
The formulas and functions also automate data calculations, which is vital for updating your dashboards. Functions like SUM, VLOOKUP, and AVERAGE can aggregate and analyze data efficiently.
Despite these features and advantages, the porous security challenges associated with Google Sheets are hard to overlook. This is where Softr comes in. Softr is an AI-native platform for building business software without code. It combines an interface builder, native Softr Databases, Softr Workflows for automation, and AI features in one full-stack platform. You can keep your data in Softr Databases, or connect Airtable, Google Sheets, HubSpot, and 17+ other data sources, including a REST API connector. Since this guide is about Google Sheets, that's the source we'll build on: Softr lets you build a user-friendly GUI (graphical user interface) for your Google Sheets data while offering maximum protection.
With Softr, you can:
Build your app with AI, a template, or from scratch
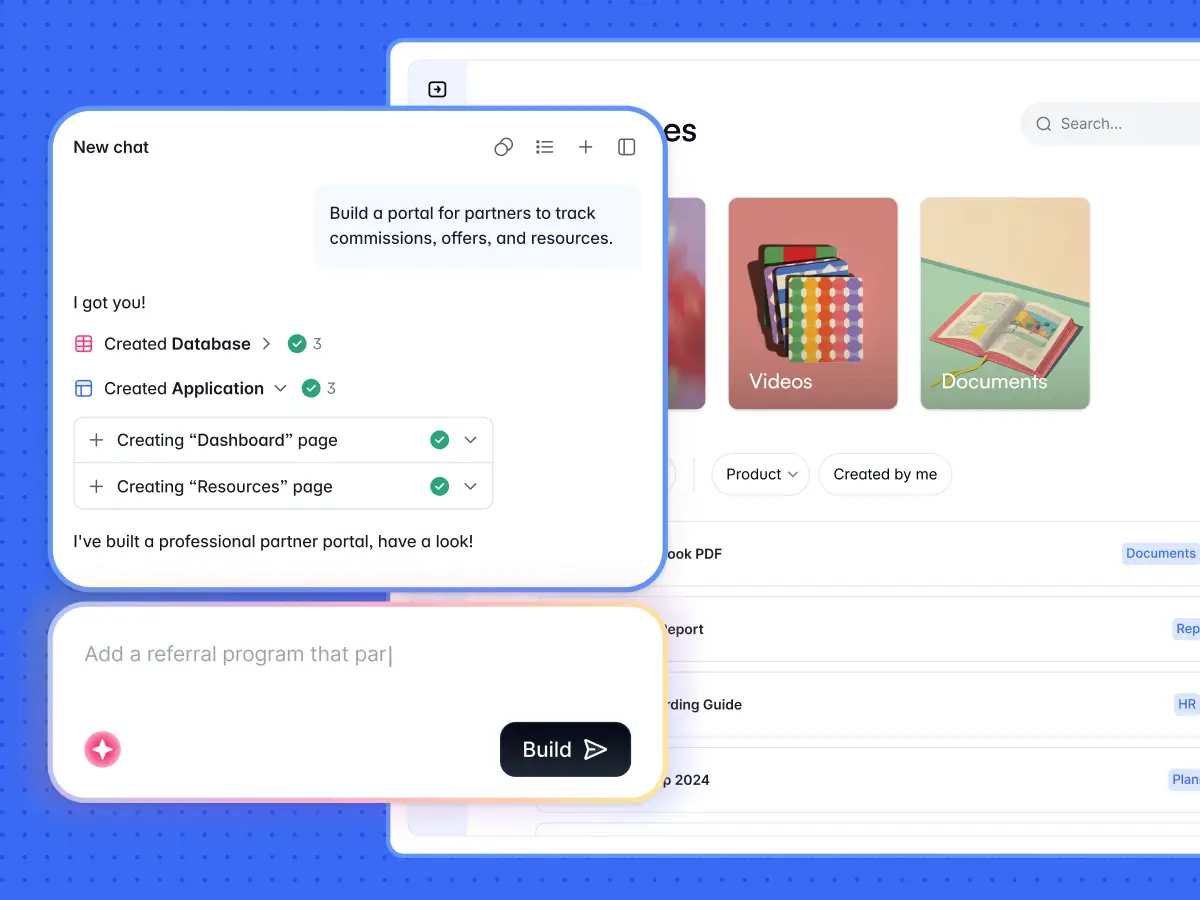
Describe what you need and the AI Co-Builder generates a complete app for you, with pages, blocks, user groups, and navigation. You can also start from a pre-built template or build from scratch if you prefer hands-on control. And once you're inside the editor, the AI Co-Builder stays available for any change you'd rather describe than configure manually.
Design your interface
Customize different pages and sections.
Table and list blocks: display your Google Sheets data in table or list format; configure columns and data types.
Create detailed views for individual records, allowing users to click on a list item and see more information.
Set up user permissions
Implement user authentication to control access to your app (allowing you to manage user roles and permissions).
Define roles such as admin, logged-in, and non-logged-in users.
Set permissions for each role to control what data users can view or edit.
Automate with workflows
Set up automated workflows for tasks like sending notifications, updating records, or triggering other actions based on changes in your data. Softr Workflows are natively triggered by UI interactions like button clicks and form submissions, and if you prefer external tools, Softr also has native integrations for Zapier, Make, and n8n.
Publish and share
Publish your app on a free or custom domain to make it accessible to your target audience. Ensure your app is responsive and looks good on all devices.
Here's how one operator describes building on top of an existing data setup:
"I find Softr very intuitive and easy to navigate, which is great for someone who is not a programmer by nature. It integrates very nicely with the databases we are already using, making it nice that it just sits on top of the systems we have. I also love the ability to control access globally, which is really important for data security and privacy." — Natalie S., Director of Operations, G2 review
How do I make Google Sheets look stunning?
You can improve Google Sheets' visual appeal by:
- Applying consistent color schemes.
- Utilizing borders and gridlines.
- Incorporating custom fonts and text styles.
- Merging cells for headings.
- Creating charts and graphs.
- Adjusting column widths and row heights.
- Alternating row colors
- Implementing dropdown menus and checkboxes.
- Hiding unnecessary rows and columns… amongst other options.
At the end of the day, Google Sheets might have design options, but they are quite limited. It's important to recognize that Google Sheets is a data source: a tool for data management and analysis, not a design platform.
This is why we're going to build a Google Sheets GUI with Softr. Our demo app will be a sales dashboard that will allow logged-in users to:
- Display a list of sales transactions with details such as date, amount, and customer.
- Allow sales team members to add new sales.
- Visualize sales performance over time.
Aim of the dashboard:
To provide real-time insights into my sales data, enhance data visualization, and improve the overall management of sales transactions.
Tutorial highlights:
- Importing sales data from Google Sheets.
- Creating forms for adding new sales entries.
- Setting up users and permissions to keep data secure.
- Setting up charts to visualize sales performance.
Before we begin, please keep the following in mind:
Tips to optimize your Google Sheets spreadsheet for no-code app (Softr) success
1. Define your data requirements
Identify the data your app will need. You can start by considering what information will be stored, how it will be structured, and the relationships to exist between different data points. Ask questions (I'll be providing answers based on the demo sales dashboard I'm going to build):
Q: What is the primary purpose of this spreadsheet?
A: To track sales, manage inventory, analyze data, create reports, etc.
Q: Who will be using this spreadsheet?
A: Identify the primary users (e.g., team members, managers, clients).
Q: What are the key data categories/fields?
A: Date, Sales Amount, Customer Name, Product, and Sales Representative.
Q: What decisions will be made based on this data?
A: I. Identify which products are performing well and which are not, and adjust marketing or sales strategies accordingly. II. Set sales targets and goals for sales representatives or teams based on historical performance data. III. Identify key customers and focus on retention strategies or upselling opportunities.
2. Structure your data with sheets and columns
Organize your data by having separate sheets (tabs) for various entities. Each sheet you create should represent a different type of data, such as "Customers," "Orders," or "Products." Within each sheet, ensure columns define specific data fields like "Name," "Email," "Order Date," and "Product ID."
3. Use clear and consistent naming practices
Use descriptive names without spaces (e.g., "CustomerAddress" rather than "Customer Address").
4. Implement data validation
Use data validation rules to maintain data integrity. For example, restrict certain columns to numerical values, specific date formats, or predefined options using drop-down menus.
5. Create unique identifiers
Each record should have a unique identifier (e.g., Product ID, Customer ID, Order ID). Unique identifiers are necessary for linking data between sheets and ensuring accurate data retrieval.
6. Establish relationships between data
Create relationships between different data entities using unique identifiers. For example, use the "Customer ID" in the "Orders" sheet to link each order to a specific customer. This step is important for effective schema structure and management.
💡 Pro tip: If your spreadsheet is outgrowing these workarounds (broken VLOOKUPs, duplicated data across tabs), consider importing it into Softr Databases instead. A single CSV import recreates your table natively, and linked record fields replace fragile cross-sheet references. The rest of this tutorial works the same either way.
Give your spreadsheet a real interface
Your Google Sheets data deserves better than coarse sharing links and crossed fingers. With a Softr GUI on top, the spreadsheet keeps doing what it's good at (storing data) while your team gets a secure, branded business app with real permissions, forms, and dashboards.
Ready to go further? Try Softr for free and build a UI connected to your Google Sheets data in minutes with the AI Co-Builder.
Frequently asked questions
- Can I use Google Sheets as a database for a business app?
- Does a Softr app stay in sync with my Google Sheet?
- Is it free to build a GUI for Google Sheets?
- How do I control who can see my Google Sheets data in the app?
- Should I keep my data in Google Sheets or move it to Softr Databases?