How to build a no-code client dashboard (+ examples & free templates)

[.blog-callout]
TL;DR
- A client dashboard is a visual reporting tool that replaces static reports and back-and-forth emails with live charts, KPI cards, and project updates.
- The fastest way to build one is with Softr: describe what you need to the AI Co-Builder, or start from our free client dashboard template.
- Softr pairs the interface with native Softr Databases, Workflows, and granular users and permissions, so each client only ever sees their own data. [.blog-callout]
If you've ever had to present your clients with data, you know how hard it can be to cut through the clutter of daily operations and deliver project updates. Back-and-forth emails, manual reporting, and managing multiple client deliverables can feel overwhelming.
Failing to translate your clients' key multi-channel performance metrics into a comprehensive data story makes it difficult for you and your clients to take action and make decisions.
Client dashboards are a valuable reporting tool in your tech stack. They offer a streamlined solution for presenting a comprehensive, real-time data story. And building one no longer requires coding skills or a developer buddy: in this post, we'll cover how to create a dashboard that simplifies client management and improves the client experience. If you'd rather skip ahead, grab our free client dashboard template.
What is a client dashboard?
A client dashboard is a visual management tool that consolidates and displays data.
It keeps clients updated about project progress, KPIs, and metrics.
Unlike static reports, dashboards automatically populate with real-time data.

Businesses can showcase data such as their monthly revenue growth using live charts.
Why do you need a client dashboard?
For client-facing businesses, dashboards offer an array of benefits:
- Automate reporting: Track performance and view project updates easily.
- Centralize platforms: Provide one source of truth for client communication and data.
- Increase efficiency: Stop compiling reports by hand; data flows into the dashboard automatically.
- Personalization: Customize as needed to display the most relevant client data.
- Consolidate project information: Connect to multiple data sources and client accounts.
- Simplicity: View important data across different teams and departments in one place.
- Streamline communication: Replace emails with real-time updates.
Dashboards are a modern (and often underrated) way to go above and beyond and visually provide transparent reporting data to clients.
The time savings are real. Music distribution agency FUGA built a client reporting portal with Softr and went from two people spending half a day every week on manual reporting exports to instant client self-service, saving over five hours a week:
"We really appreciate how we can set user-specific visibility, clients see only what they need to see, nothing more." - FUGA, Softr customer story
Client dashboard examples
Let's look at a few examples of dashboards you can create with Softr, the AI-native platform for building business software without code. Softr combines an interface builder, native Softr Databases, and Softr Workflows in one place, so you can build client portals, dashboards, and internal tools that run on live data.
Analytics dashboard
Let's look at these startup metrics from Softr's analytics dashboard template for inspiration.

With client dashboards, you can communicate client data visually and transparently.

Businesses can showcase data such as their monthly revenue growth, site traffic, and more using real-time charts in Softr's analytics dashboard.
These are great examples of interactive, live charts that are automatically updated to provide total transparency while requiring minimal team time and effort.
Operations dashboard
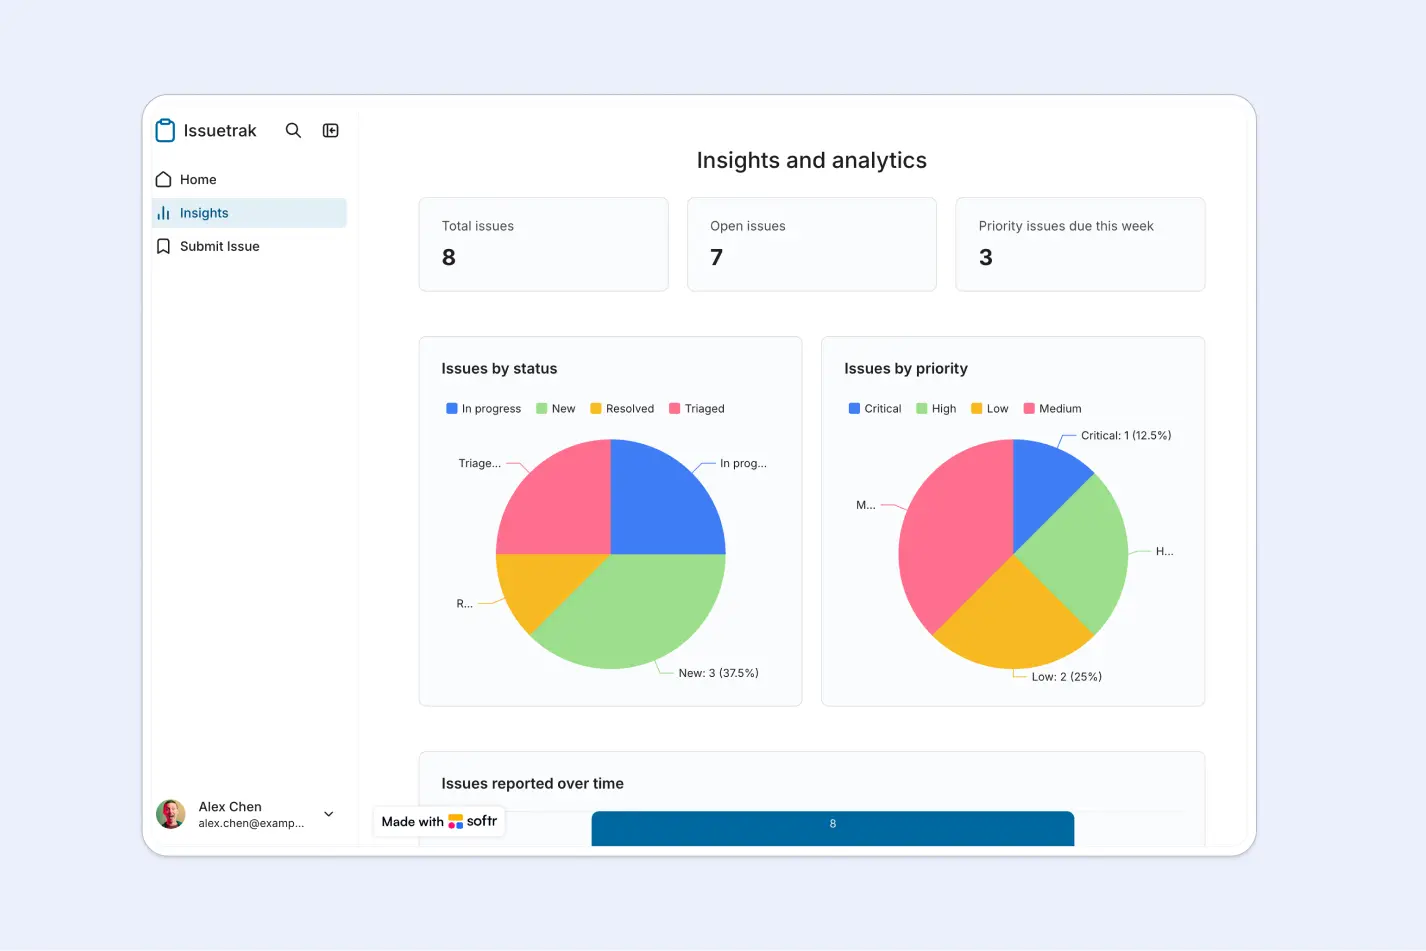
Dashboards aren't just for marketing metrics. Internal and operations teams use them to track work in progress, like this issue tracker overview built with Softr's chart blocks and KPI cards:
Legal dashboard

Law firms and consultants can use a legal dashboard to give clients access to case details and documents.
- Case timelines, milestones, and court schedules.
- Secure document sharing for contracts and legal files.
- Real-time updates on case progress.
Try Softr's legal case management template to keep track of all your cases, clients, and billing, with a separate login for clients.
Custom client portal
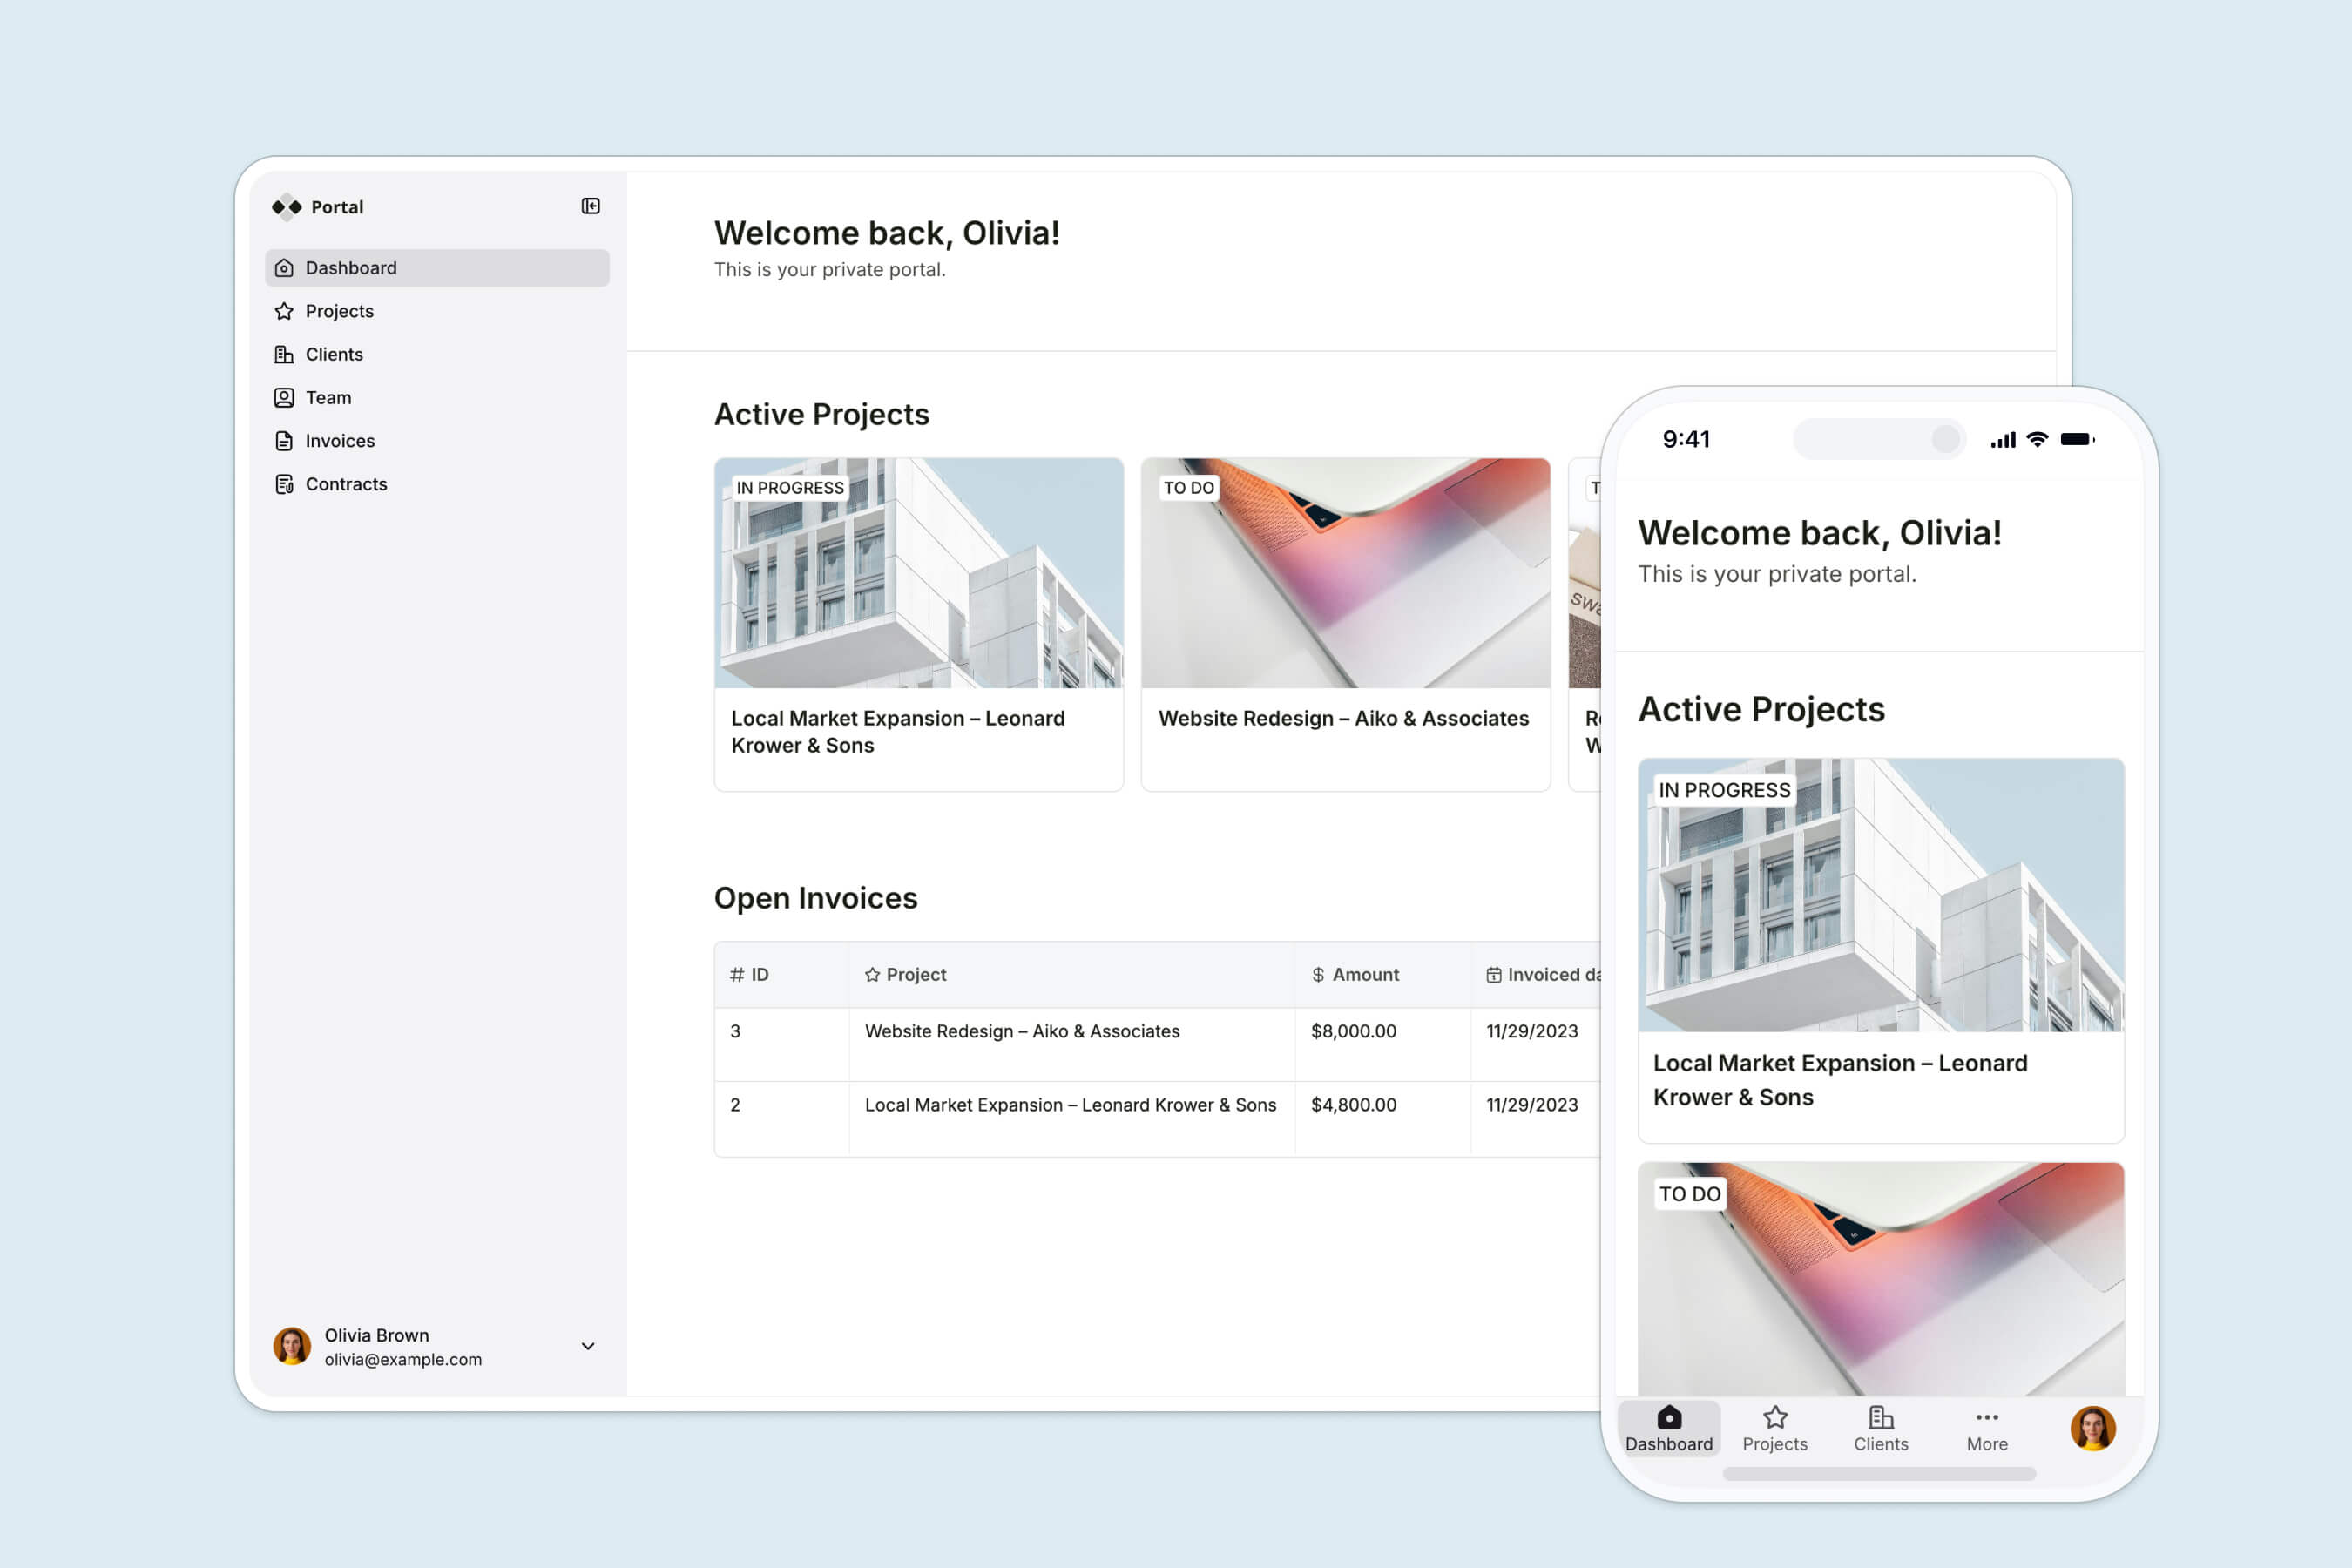
A client portal gives clients a central place to view projects, tasks, files, and invoices.
For more flexibility, a client portal offers a secure way to share project information, updates, documents and reports, and communications with your clients.
With Softr's free client portal template, you can build a fully customizable portal in minutes:
- Built-in forms for client onboarding and feedback.
- Pre-built blocks like tables, charts, lists, kanbans, and more to visualize and interact with your data.
- Real-time reporting on KPIs, metrics, and progress.
- Secure document upload and sharing capabilities.
- Create a support & resources hub with articles, videos, and FAQs for client self-service.
- Include a section for invoices and payments with support for Stripe, PayPal, and more.
- Ask AI on any data block, so clients can query their own data conversationally instead of digging through tables.
What should a client dashboard include?
Depending on your use case, your client dashboard might include these elements:
- Project updates: Share project timelines, similar metrics, and completion statuses.
- Key metrics: Allow clients to track performance metrics relevant to their goals.
- Budget tracking: Provide a clear overview of spending and financial progress.
- Data visualization: Use custom widgets, charts, and graphs to visualize your data.
- Resource hub: Add a knowledge base or FAQs.
What to look for in client dashboard tools
When selecting client dashboard software or no-code solutions, choose one that offers flexibility and functionality. Here are a few features to look for:
1. Integrates with multiple data sources
Your client dashboard software should let you store data natively (like Softr Databases) and connect seamlessly with tools like Airtable, Google Sheets, and your CRM. Softr supports 17+ data sources, including a REST API connector, so dashboards populate with real-time data automatically and you never have to compile reports by hand.
2. Customizable design options
Look for software that allows you to include custom widgets that meet your clients' needs. A drag-and-drop interface and options to add branding elements, such as custom colors, fonts, and fields, make it easier to build dashboards aligned with your brand. In Softr, pre-built blocks cover most needs, and the Vibe Coding block lets you generate fully custom components with AI when you need something unique, like a bespoke chart or calculator.
3. Client access permissions
You want full control over access settings to determine the data each client can view. Features like dashboard menu items for different user groups and client-specific permissions provide complete control over data visibility.
4. Data visualization tools
Dashboards should make it easy to visualize your data. Look for options like live charts, KPI cards, graphs, and tables that track performance, project updates, and similar metrics. These tools help clients understand key insights at a glance.
5. Built-in reporting tools
The best client dashboard software simplifies reporting with reporting tools that automatically update. For a deeper comparison of dedicated options, see our roundup of client dashboard software.
6. Streamlined communication features
Some dashboard tools integrate with customer engagement platforms like Intercom and CRM software to track and manage customer interactions across chat and email. In Softr, you can also enable record commenting directly on data blocks, so conversations stay attached to the project or deliverable they're about.
7. User-friendly platform
Ease of use is important, especially for non-technical teams. Choose software with a user-friendly platform, clear navigation, simple settings, and intuitive workflows.
"The learning curve is not steep, and there are loads of new features which make my creations come to life better than I anticipated. Our web portal for individual clients and enthusiasts could not have been built and launched so quickly if it were not for Softr." - Ken N., Director, G2 review
How to build a dashboard for clients
Now that we have a good understanding of client dashboards and how they can help your business, it's time for the fun part: how to build one.
With Softr, there are three ways to start. Describe what you need and the AI Co-Builder generates a complete app for you (database, pages, charts, and user groups included), start from a pre-built template, or build from scratch with the visual editor. Whichever path you pick, you get:
- No developer costs and no code to maintain.
- Easy setup, with plenty of templates available.
- Native Softr Databases, plus connections to Airtable, Google Sheets, Notion, HubSpot, and 17+ data sources for real-time updates.
- Client access and permissions to secure client information.
- A granular level of customization for non-technical teams.
Ready to create your own dashboard? Let us show you how!
Step 1: Set your objectives and strategy
As with any project, planning and strategy come first. Ask yourself these key questions:
- Why do you want to build a client dashboard?
- What client information needs to be included?
- Which sources will these data points be extracted from?
- What dashboard features will your client need?
- How will you track performance and share results?
Addressing these basic questions will prevent starting something you'll eventually have to fix (trust us, we've been there!).
Here are four key tips for planning your client dashboard project:
- Keep the client in mind. As exciting as the project is, it should be about their needs.
- Choose your data carefully. Select relevant data points that address client goals and accurately deliver key information.
- Pay attention to the chart type. Different chart styles convey different messages, so choose visualization types representing the project information you want to convey.
- Involve the client. The best and easiest way to ensure you're doing things right is to share with the client and get their insights.
Step 2: Build your dashboard
On to the fun part: It's time to build!
The fastest path is to describe your dashboard to the AI Co-Builder ("a client dashboard with project status, monthly revenue charts, and an invoices table") and let it generate the database, pages, and chart blocks for you. Prefer a head start you can see? Begin with Softr's client dashboard template and follow the instructions for connecting your own data. This step-by-step help guide and tutorial video will also walk you through the building process.

Store your data in Softr Databases (you can describe your data structure to the Database AI Co-Builder and it will generate the tables and fields for you), or pull it in from existing sources to create Airtable dashboards. To visualize your data and provide real-time updates, you can select from different types of charts, including bars, lines, areas, scatters, pies, donuts, and roses, and add KPI cards for headline numbers.

The building process will be familiar if you've built a chart in Excel or Google Sheets. After selecting the table and view the data should come from, you get to play around with the charts, selecting the X and Y axes, orientation, design, and more. If you're setting up several charts at once, you can also just ask the AI Co-Builder to add and configure them for you by describing what each one should show.
Check out our documentation to learn more, or watch this video from Automation Helpers' Dan Leeman for step-by-step instructions:
Step 3: Customizing your dashboard
The sky's the limit here. User accounts and permissions enable you to assign different dashboards for different user groups, for example:
- General KPI overview for managers.
- Manage timelines and track project progress.
- Quarterly ad spending and budget for the marketing team.
Configure user permissions and settings for complete control over who sees specific data. Each client signs in to their own view and only ever sees their own projects, metrics, and documents.

You can also turn on Ask AI on any table or list block, letting clients ask questions about their data in plain language ("how did paid traffic trend this quarter?") instead of scanning rows.
Customize the layout and add your branding.

In the upper right corner, click Publish when finished.
Step 4: Share with clients and adapt
Provide your clients with a shareable link to access these charts. Involving clients at this stage can be valuable in understanding who has access to these charts and which data they need most. This will turn your client dashboards into an iterative and collaborative relationship, providing more value to your clients.
You can also add Softr Workflows to keep the dashboard working for you: notify a client when a milestone is reached, or alert your team when a budget threshold is crossed. Describe the automation you need to the Workflow AI Co-Builder and it will build the logic for you.
Now that your client dashboard is up and running, consider providing your clients with features such as extra collaborators, custom domains, single sign-on, creating a Progressive Web App, and more.

Explore Softr plans and pricing and determine which could be relevant for your project.
Build your client dashboard today
Client dashboards streamline communication, enhance transparency, and save you and your clients time. With Softr, creating a dashboard is easy, affordable, and tailored to your needs.
Try Softr's free client dashboard template and start building dashboards your clients love.
Frequently asked questions
- What's the difference between a client report and a client dashboard?
- How do I create a client dashboard?
- Can I create a client dashboard without coding?
- What is a client dashboard template?
- How do I share a client dashboard with clients?