


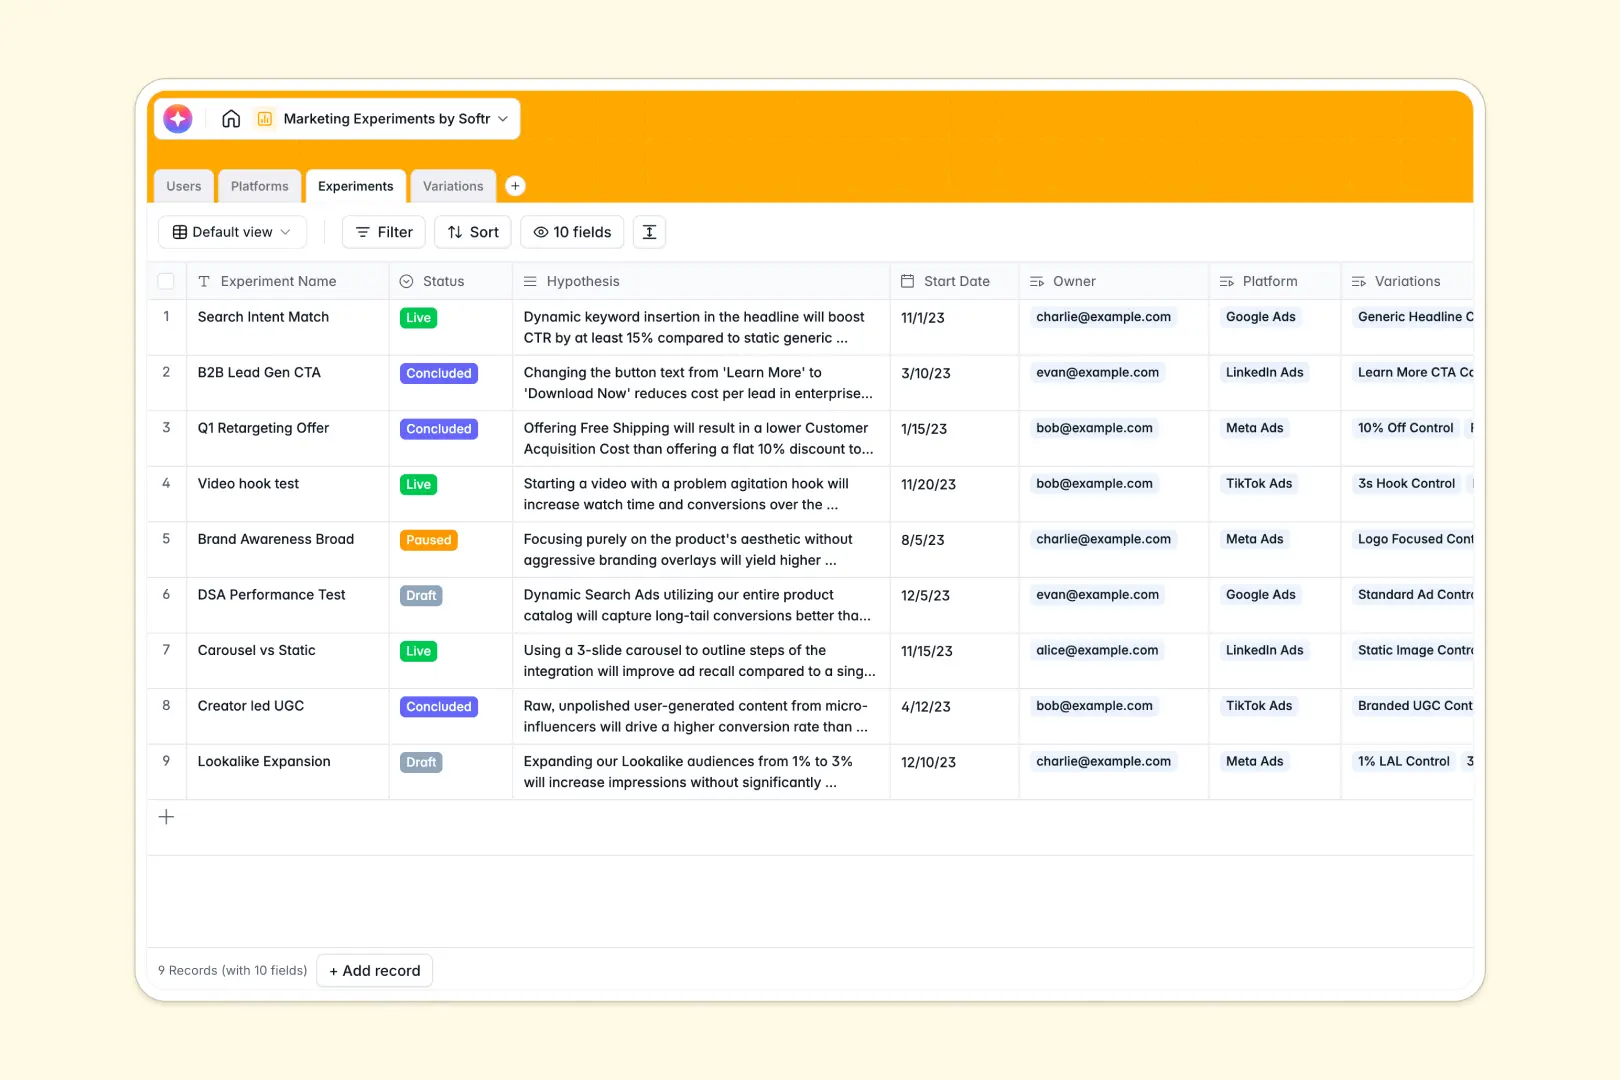
Your Marketing Experiments database at a glance
This database helps growth teams track campaigns, formulate hypotheses, and measure performance without scattered data. It brings your tests, platform details, and results into one unified view.
The template inherently connects overarching experiments to specific platform variations (like A/B tests). Instead of manually calculating totals, it rolls up spend and clicks automatically from individual variants to give you the big picture instantly.
Built-in AI agents act as your data analyst as tests run. The AI automatically evaluates variant ROI and drafts a final conclusion based on your original hypothesis and actual performance numbers.
Why marketing tests get messy in spreadsheets
Tracking active campaigns, variations, and creative assets in a single grid quickly becomes unmanageable. When multiple marketers update spend metrics across different tabs, errors multiply and crucial insights get buried.
What a structured database changes
In a structured system, your data stays organized because every metric has a defined format. Attachments stay directly tied to their specific ad variation, and formulas calculate click-through rates perfectly every time.
You can easily link multiple test variations back to one core experiment without relying on fragile formulas. This ensures your growth data scales cleanly, which is exactly what Softr Databases are designed for.
What you can do with this template
Instantly document hypotheses, log specific platform metrics, and compare control versus variant performance side-by-side. Everything is pre-configured so you can start logging tests today.
You can also leverage Database AI agents automatically to write comprehensive performance summaries based on your live spend and conversion data. The system scales effortlessly as your testing frequency increases.
-
Users
Manage marketing team members with roles, contact info, and experiment ownership
-
Platforms
Catalog marketing channels with AI-generated descriptions based on their website
-
Experiments
Centralize test campaigns with AI-summarized conclusions and performance outcomes
-
Variations
Track ad assets and treatments using AI to analyze ROI and performance efficiency
Who is this Marketing Experiments database for
This template is designed for growth teams who need a reliable, scalable way to measure marketing tests.
- Growth Marketers: Document hypotheses and track exact variation metrics like impressions and conversions in real time.
- Marketing Managers: Monitor total spend across all channels and review auto-generated experiment conclusions.
- Admins: Manage team roles, ensuring only the right contributors can update live campaign statuses.
How to take it further
Start by customizing the database to fit your exact testing framework. You can easily add new advertising platform choices or tweak the AI prompts to analyze metrics according to your specific KPI definitions.
Next, import your historical test data. Use the CSV import tool to bring in previous campaign results so your team has an immediate, searchable archive of past learnings.
When your team is ready, you can use the interface builder to create a custom internal portal for your marketing department. This elevates the database into a fully functional application.
By setting up proper users and permissions, you can ensure leadership only sees high-level summaries while growth leads manage day-to-day variation data. Building custom tracking apps is incredibly fast when your database is cleanly structured from day one.
-
1
-
2
-
3
-
4
Frequently asked questions
-
What is a marketing experiments database?
-
Why use a no-code database to build a testing system?
-
How can AI help managing data for marketing experiments?
-
Can I build an app with this marketing experiments database?
-
Is this Marketing Experiments template free?
-
How is a marketing experiments database different from a spreadsheet?
Start building today. It's free!
Build and launch your first app in under 30 minutes.