


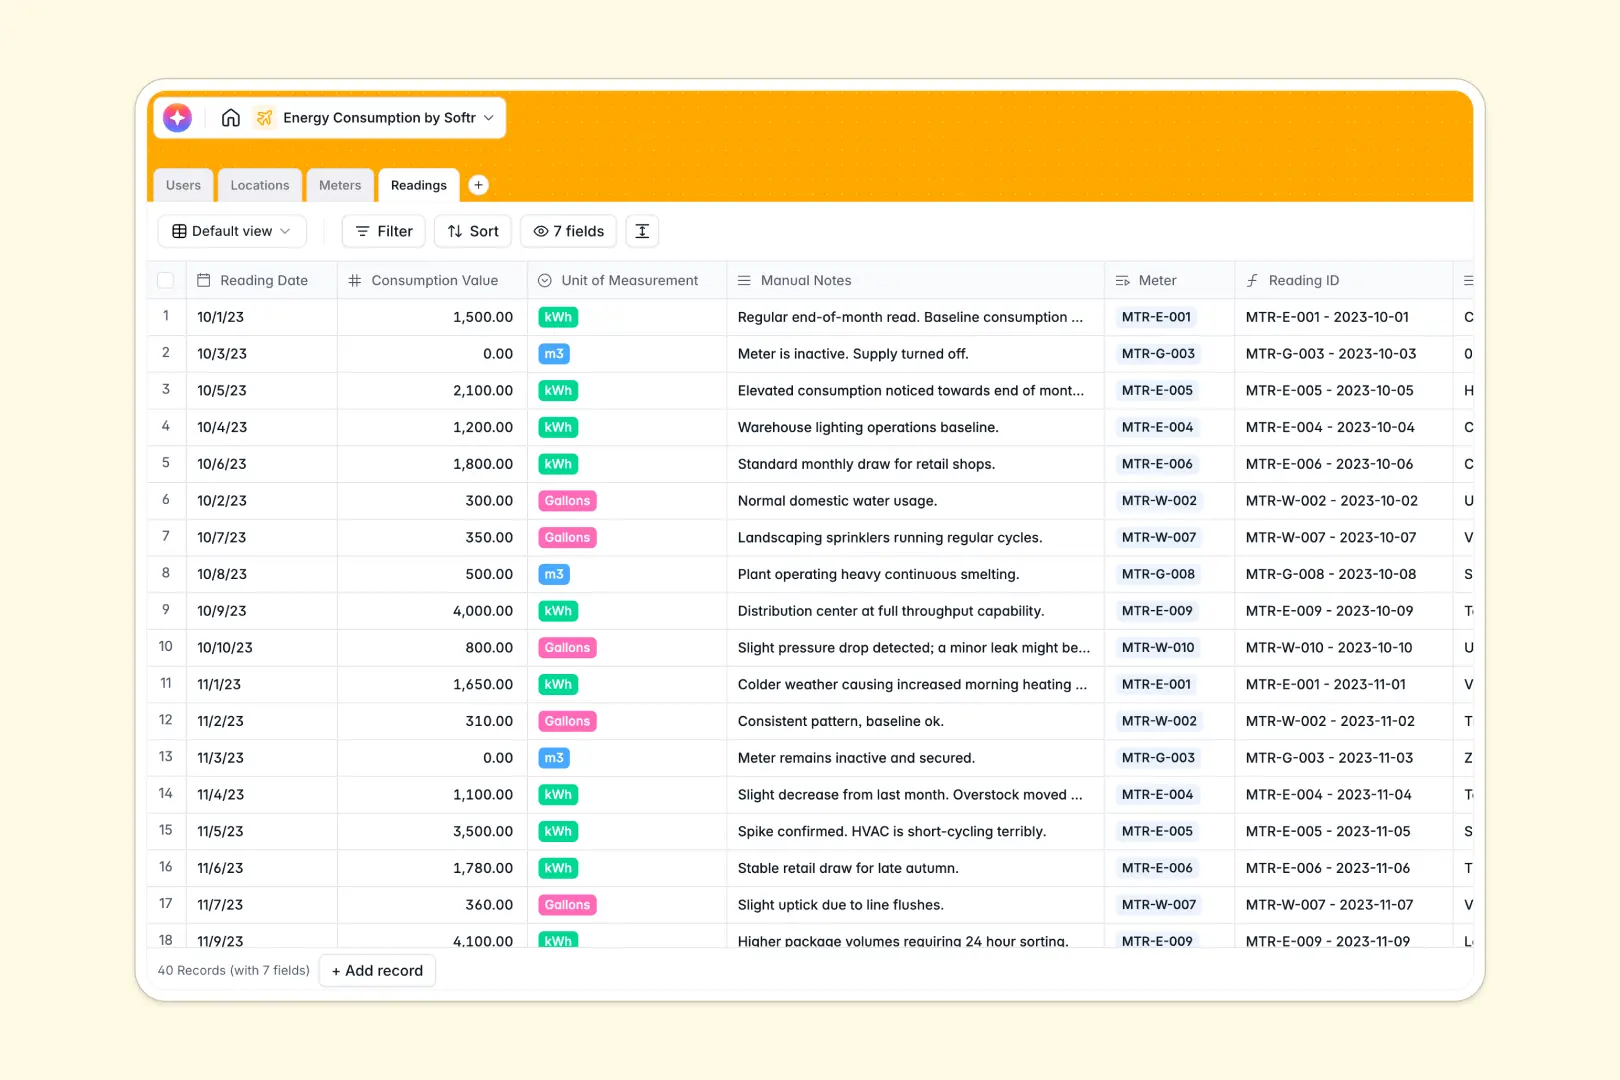
Your Energy Consumption Database at a glance
This Energy Consumption Database helps property managers track utility usage across operations. Monitor meters and record real-time readings effortlessly without losing critical data.
The system elegantly connects four key tables: incoming utility Readings automatically link to specific Meters, which tie directly to your physical Locations. This relational structure instantly rolls up total energy consumption.
Built-in AI automatically searches the web to generate accurate building overviews based on location addresses. It also analyzes and summarizes individual meter readings on the fly for your analysts.
Why tracking energy consumption in spreadsheets breaks down
As your property portfolio scales, managing energy data in Google Sheets quickly becomes a fragile mess. Mixed data types and broken cross-sheet references make accurate utility analysis nearly impossible.
What a structured database changes
A structured system enforces strict column rules, meaning consumption numbers stay numbers and reading dates stay dates. You can effortlessly link a specific electricity meter to a physical location without copy-pasting serial numbers.
This is exactly what Softr Databases are designed for. They replace chaotic spreadsheet rows with clean, scalable tables that keep your metrics completely accurate as you expand.
What you can do with this template
Log real-time utility readings mapped perfectly to their specific measurement devices and properties. You can immediately view total recorded consumption across your entire operation using automated rollups.
Native AI agents instantly interpret consumption spikes based on reading values and manual notes. This eliminates tedious data review and frees up your analysts to focus on optimization.
-
Users
Manage system access for property managers, analysts, and administrators
-
Locations
Track buildings utilizing AI to generate summaries and overview reports
-
Meters
Monitor utility measurement devices and their active operational status
-
Readings
Log consumption data with AI-powered analysis to summarize findings
Who is this Energy Consumption Database for
This system is built for teams managing physical properties, infrastructure, or sustainability initiatives.
- Property Managers: Track active vs. inactive meters across assigned locations without hunting through messy spreadsheets.
- Energy Analysts: Monitor aggregated utility usage trends to spot infrastructure inefficiencies directly.
- Sustainability Admins: Maintain a single source of truth for energy metrics to streamline compliance and reporting.
How to take it further
Start by customizing the database structure to fit your utility ecosystem exactly. Modify the select fields to add custom units of measurement or adjust maintenance statuses natively.
Easily migrate your historical utility logs without data loss or delays. Bulk import past meter readings directly via CSV to populate your new centralized system immediately.
When your team needs field access, you can naturally build an operational portal around this data. Transform your backend into an internal app where property managers log readings securely from their mobile devices.
By configuring robust users and permissions, analysts can see global trends while local operators only view their assigned buildings. A well-organized database makes building this secure front-end incredibly simple.
-
1
-
2
-
3
-
4
Frequently asked questions
-
What is an energy consumption database?
-
Why use a no-code database to track energy consumption?
-
How can AI help managing data for energy consumption?
-
Can I build an app with this energy consumption database?
-
Is this Energy Consumption Database free?
-
How does this template differ from an energy consumption spreadsheet?
Start building today. It's free!
Build and launch your first app in under 30 minutes.