


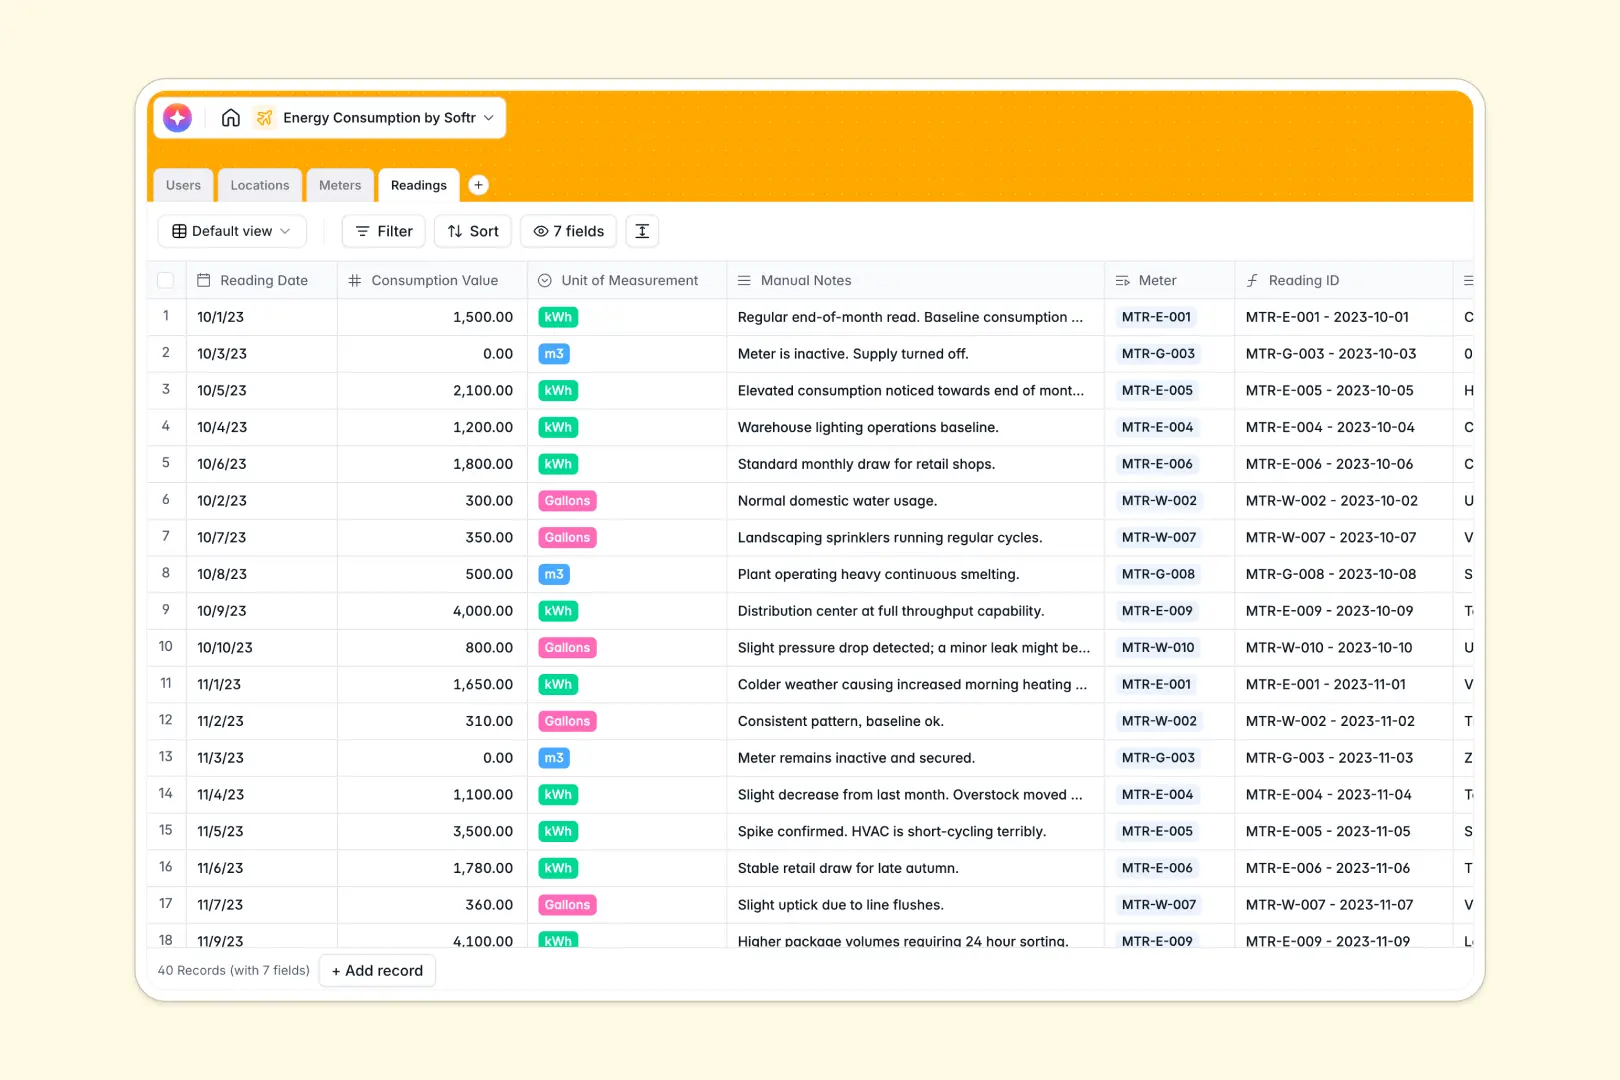
Your Energy Consumption Database at a glance
Track energy data across all your buildings without messy spreadsheets. Monitor electricity, gas, and water usage in one single source of truth.
Link specific meters directly to your physical locations and assign property managers to oversee them. Every new reading automatically rolls up to show total consumption per meter.
Database AI agents automatically research building overviews and summarize reading notes based on consumption values. This ensures you always have complete, accurate context for your usage data.
Why tracking energy consumption in Google Sheets breaks down
Managing utility logs in spreadsheets quickly becomes a nightmare when you have multiple locations and meters. Formulas break, units of measurement get mixed up, and tracking historical data is nearly impossible without scrolling endlessly.
What a structured database changes
A structured database enforces strict column types so data stays completely clean. An electricity reading in kWh won't accidentally get mixed up with a water reading in gallons.
Instead of relying on fragile VLOOKUPs, you connect consumption logs directly to meters and locations. This natural relational structure is exactly what Softr Databases are built to provide.
As your portfolio grows from two buildings to twenty, your data remains perfectly structured. You never have to duplicate tabs or fear that someone will accidentally delete a critical row.
What you can do with this template
Instantly view total recorded consumption for any active or inactive meter. Assign clear ownership by linking locations directly to specific analysts or property managers.
Automatically generate reading analysis and building overviews using native AI, saving hours of manual data entry. Start organizing your usage data today with a fully functional system that scales seamlessly.
-
Users
Manage system access for property managers, analysts and admin staff
-
Locations
Track physical properties with AI-generated building overviews via web search
-
Meters
Monitor utility measurement devices for electricity, water and gas tracking
-
Readings
Log consumption records with AI-powered trend analysis and automated summaries
Who is this Energy Consumption database for
This database is built for teams that need to track utility metrics efficiently across multiple sites.
- Property Managers: Track active meters and monitor usage anomalies across managed physical locations.
- Energy Analysts: Evaluate total recorded consumption to identify trends and reduce utility costs.
- Facility Operators: Maintain a reliable log of manual reading notes and maintenance requirements.
How to take it further
Easily modify the dropdown choices for utility types or add new units of measurement. You can adjust the automated rollup formulas to calculate costs alongside consumption metrics.
Bulk upload your historical readings or connect via API to sync real-time data from smart meters directly. This instantly brings your existing utility history into one secure timeline.
When your team needs controlled access, you can easily use an interface builder to turn this data into a secure portal. Give managers access to view their own building data without exposing the entire company's database.
Setting proper users and permissions ensures everyone only sees what they are authorized to manage. A well-structured database makes launching a powerful tracking app incredibly simple.
-
1
-
2
-
3
-
4
Frequently asked questions
-
What is an energy consumption database?
-
Why use a no-code database to track energy consumption?
-
How can AI help managing data for tracking consumption?
-
Can I build an app with this energy consumption database?
-
Is this Energy Consumption database template free?
-
How is this database different from tracking utilities in Google Sheets?
Start building today. It's free!
Build and launch your first app in under 30 minutes.