

Your A/B Testing Log database at a glance
This template replaces scattered spreadsheets with a single source of truth for all your conversion rate optimization efforts. It connects the team running tests directly to the active experiments and their specific variants.
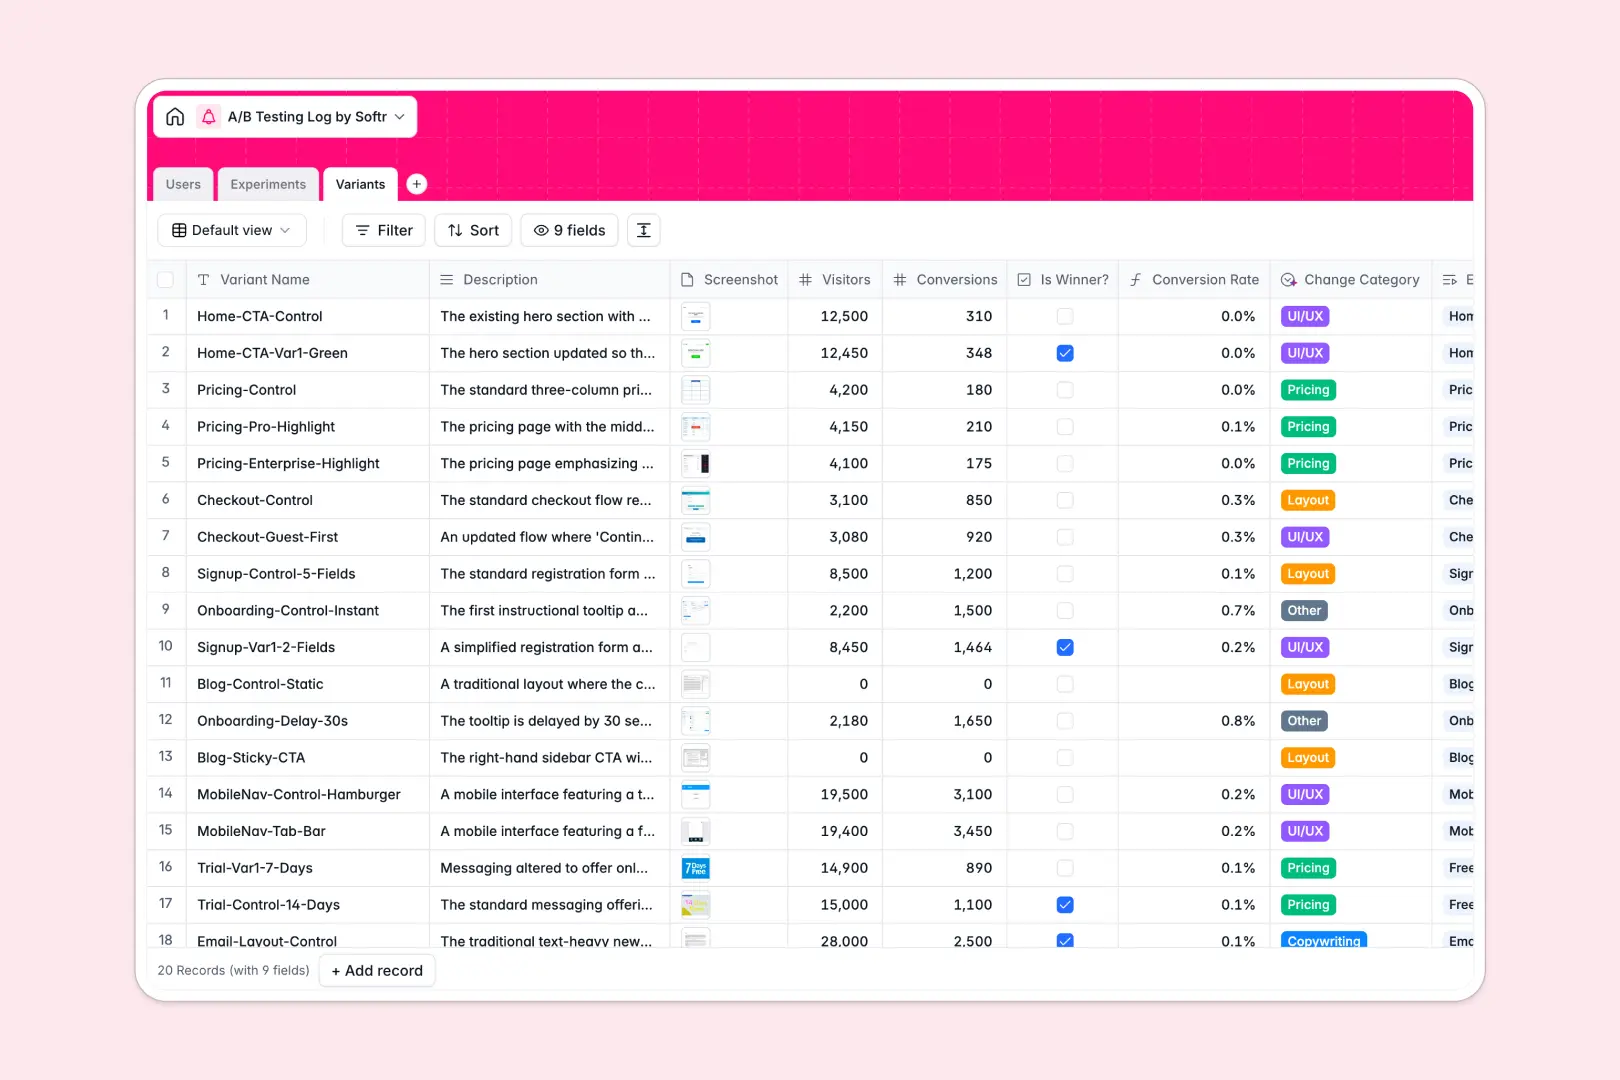
Instead of flat rows, experiments link effortlessly to multiple visual variants, auto-calculating conversion rates and summarizing total visitors. You can attach screenshots right next to the metrics for complete context.
Built-in AI automatically categorizes test types based on variant descriptions and drafts high-level executive summaries of your test conclusions. This means less manual data entry and faster sharing of winning results.
Why logging A/B tests gets messy in Google Sheets
As your testing velocity grows, forcing parent experiments, multiple text variants, screenshots, and complex conversion formulas into a single spreadsheet quickly turns into a navigation nightmare.
What a structured database changes
In a proper system, data types are strictly enforced so your formulas do not break when someone accidentally types text into a number column. Attachments like UI screenshots live neatly inside the record, not as floating URLs.
More importantly, you can natively link multiple design variants to a single experiment without relying on fragile VLOOKUPs. This ensures one table equals one object, which is exactly what Softr Databases are designed for.
What you can do with this template
Instantly view all drafted, running, and concluded tests alongside their AI-generated summaries in one clean dashboard.
Automatically calculate conversion rates for every variant and easily flag the overall winner without touching a single complex formula.
-
Users
Manage team members responsible for designing and analyzing experiments
-
Experiments
Track the testing pipeline with AI-generated high-level executive summaries
-
Variants
Analyze test variations with AI-powered categorization of design changes
Who is this A/B Testing Log database for
This structural framework is built for teams driving growth and product optimization:
- Growth Marketers: Track campaign experiments, pause underperforming variants, and easily report on conversion lifts.
- Product Managers: Align new feature rollouts with hard data and maintain a clean historical archive of what worked.
- Data Analysts: Centralize hypotheses and metric tracking securely without digging through broken team spreadsheets.
How to take it further
Start by customizing the database fields to match your exact testing terminology. You can easily add new progress statuses, tweak the AI prompts, or incorporate custom baseline metrics.
Next, import your historical test results directly via CSV. This instantly populates your archive so you do not lose past experiment learnings.
When you are ready to share results across the company, build a full web app around this data. You can easily set up proper users and permissions so executives can read summaries while only the core team can edit variants.
By starting with a structured database, developing a secure and scalable internal testing portal becomes completely frictionless.
-
1
-
2
-
3
-
4
Frequently asked questions
-
What is an A/B testing log database?
-
Why use a no-code database to build an A/B testing log?
-
How can AI help managing data for an A/B testing log?
-
Can I build an app with an A/B Testing Log database?
-
Is this A/B Testing Log free?
-
Why are spreadsheets bad for logging A/B tests?
Start building today. It's free!
Build and launch your first app in under 30 minutes.