


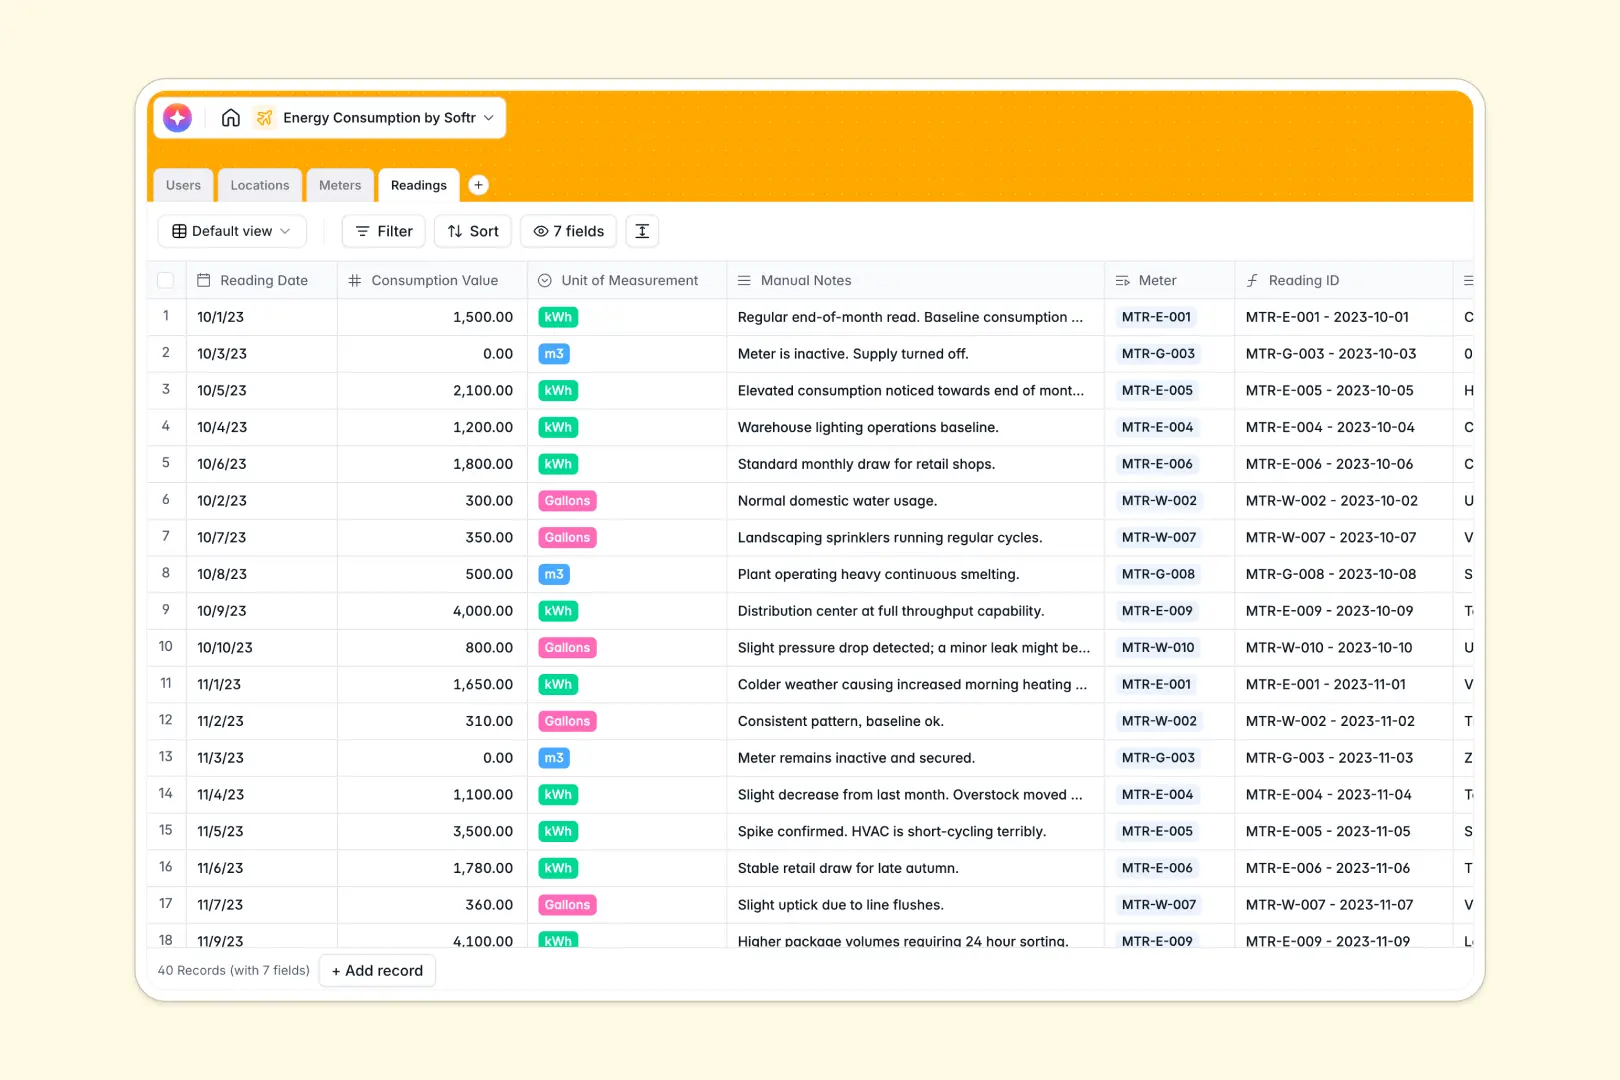
Your Energy Consumption Database at a glance
Tracking electricity, gas, and water across multiple facilities shouldn't require manual data entry across disconnected tabs. This template gives property managers and analysts a unified system to log utility readings, check meter health, and measure total usage.
It links your specific Meters to physical Locations, automatically rolling up total consumption for each site. When a new Reading is logged, it ties back directly to the correct meter, ensuring a clean historical record of timestamps and values.
Built-in AI automatically generates building overviews based on location addresses and writes instant analysis summaries for every reading, turning raw numbers into actionable asset insights.
Why managing energy consumption in spreadsheets breaks down
Tracking utility readings in rows often leads to mismatched inputs, broken formulas, and a messy history. Scaling across multiple properties makes it impossible to quickly see which meters need maintenance or how total usage trends over time.
What a structured database changes
Instead of fragile VLOOKUPs connecting meters to buildings, structured data ensures every meter natively links to its specific location. Data types stay consistent, meaning dates remain dates, and unit measurements like kWh or Gallons are strictly enforced.
This is exactly what Softr Databases are designed for. As your logged entries grow, your data remains fully intact without slowing down, making it easy to generate reliable site-specific rollups.
What you can do with this template
Start logging consumption entries immediately with a pre-configured schema that handles various utility types. Property managers can easily filter and check active, inactive, or maintenance-required statuses for devices across any site.
Thanks to native AI workflows, you can automatically pull in web-searched metrics for your physical locations. You can also securely summarize reading anomalies in real time without writing complex sorting scripts.
-
Users
Manage administrative staff and property managers with contact info and roles
-
Locations
Track physical buildings with AI-powered overviews generated from addresses
-
Meters
Register utility measurement devices and monitor their current operational status
-
Readings
Log energy usage data and use AI to provide summaries of consumption findings
Who is this Energy Consumption Database for
This template is designed for teams managing physical infrastructure and sustainability metrics.
- Property Managers: Centralize oversight for multiple locations and quickly identify when a device requires maintenance.
- Energy Analysts: Maintain clean logs of electricity, gas, and water usage to accurately calculate aggregate consumption.
- Facility Administrators: Assign users to specific sites to assure accountability and compliance for regular utility check-ins.
How to take it further
Customize this database instantly to fit your specific infrastructure needs. Add brand new utility types, tweak the select fields for meter statuses, or easily rename columns to match your existing nomenclature.
You can bring this template to life by importing historical utility usage data directly via CSV. Alternatively, use an API to sync live meter updates directly into your new table structure.
Once your data is clean and structured, launching a custom portal on top of it is a breeze. Full-stack apps combine this exact database with dynamic interfaces and seamless internal workflows.
Using advanced permissions, you can ensure analysts only see data for the specific sites they manage, while allowing admins to view global utility metrics across all locations.
-
1
-
2
-
3
-
4
Frequently asked questions
-
What is an energy consumption database?
-
Why use a no-code database to build an energy consumption tool?
-
How can AI help manage energy data?
-
Can I build an app with this energy consumption database?
-
Is this Energy Consumption Database free?
Start building today. It's free!
Build and launch your first app in under 30 minutes.