

Your Sales KPIs Dashboard database at a glance
Track your deals, manage team goals, and monitor sales performance accurately in one structured place. It automatically calculates goal attainment and sorts deals by stage.
The database connects your reps, deals, and targets seamlessly. Instead of manually updating totals, closed deals automatically roll up into your team's goals.
Why tracking sales KPIs in spreadsheets breaks down
Spreadsheets quickly become chaotic when tracking real-time sales data. Rows get pasted over, VLOOKUPs between deals and reps break, and getting a clear overview takes hours of manual formatting.
What a structured database changes
A structured approach means your data stays clean and reliable as your team grows. Currency fields only accept strict numbers, and dates stay formatted correctly so your closing month formulas never break.
Instead of fragile sheets, you can link deals directly to owners and track their progress automatically. This is exactly what Softr Databases are designed for.
What you can do with this template
Instantly view your pipeline by deal stage and track exact attainment percentages for every rep. You can easily adjust goal timelines or add new custom stages.
As your process scales, you can even add Database AI agents to automatically enrich company names or summarize deal notes. It is a completely ready-to-use foundation for your revenue team.
-
Users
Manage sales staff with identity profiles, roles, and linked targets
-
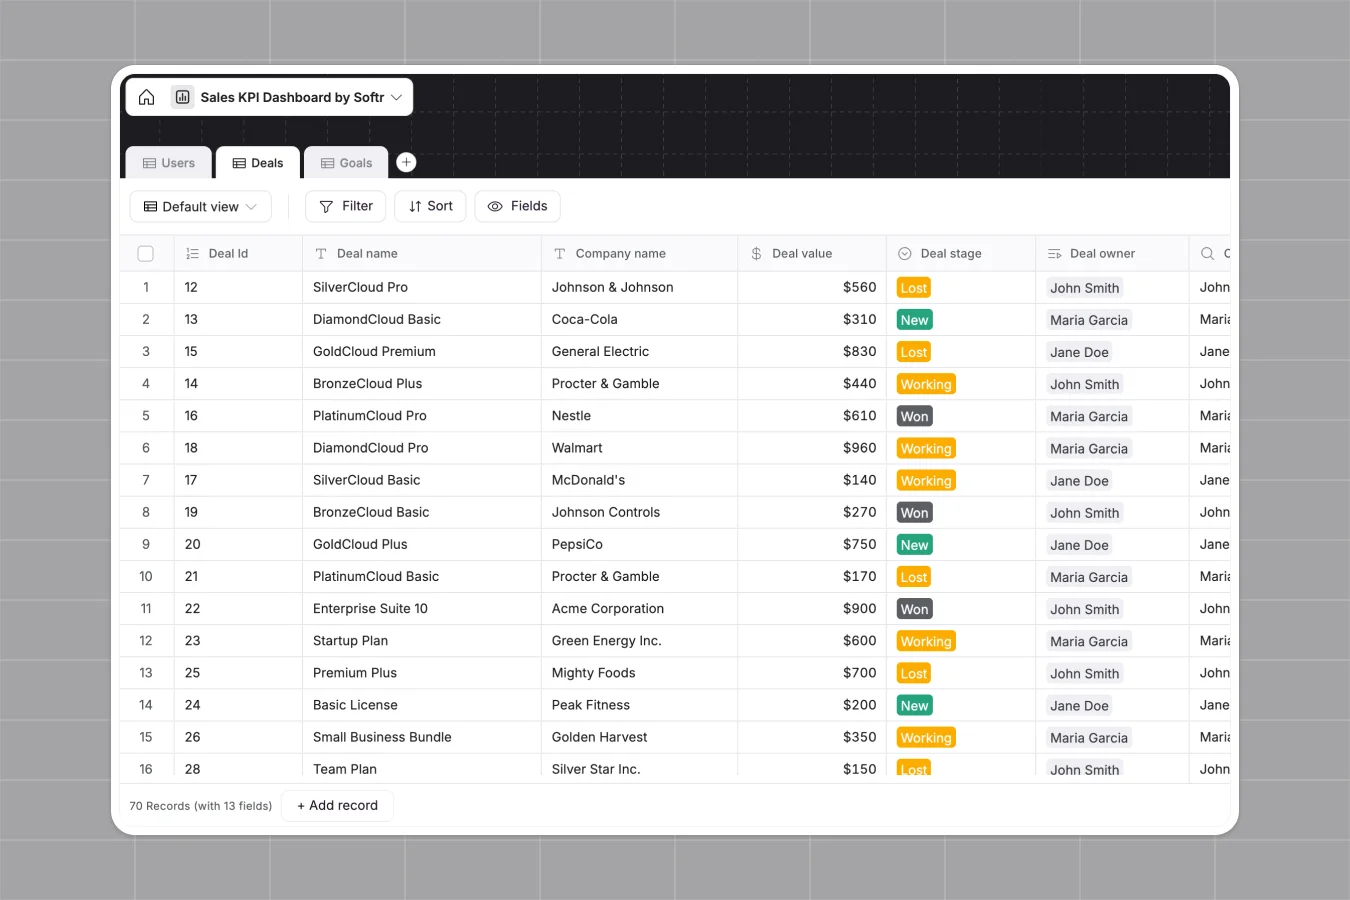
Deals
Monitor sales pipeline status, valuations, and owner assignments
-
Goals
Track performance targets with attainment metrics and owner progress
Who is this Sales KPIs Dashboard database for
This system is built for teams who need clear visibility into their pipeline and targets.
- Sales managers: Track team pacing, monitor deal stages, and view individual goal attainment in real time.
- Sales representatives: Manage daily tasks, update deal statuses, and see exactly how close they are to hitting quota.
- Founders: Get an instant overview of total pipeline value and projected closed won revenue.
How to take it further
Start by customizing the database to fit your exact sales cycle. You can easily modify the deal stage dropdowns or adjust the formulas for calculating goal periods.
Next, bring in your current pipeline data. You can import your existing deals and past goals via CSV in seconds to get immediate visibility.
When your team is ready, you can transform this foundation into a complete internal tool using the interface builder.
You can implement granular users and permissions so reps only see their own active deals, while managers see the entire team's performance. A well-structured database makes building these secure, scalable apps effortless.
-
1
-
2
-
3
-
4
Frequently asked questions
-
What is a sales KPI database?
-
Why use a no-code database to build a sales tracking system?
-
How can AI help managing data for sales tracking?
-
Can I build an app with this sales KPI database?
-
Is this Sales KPIs Dashboard template free?
-
Why do spreadsheets fail for sales KPI tracking?
Start building today. It's free!
Build and launch your first app in under 30 minutes.