

Your Sales KPIs Dashboard database at a glance
This template replaces scattered spreadsheets with a single connected system for tracking sales goals, deal progress, and rep performance. You get real-time visibility into revenue metrics without manually updating formulas.
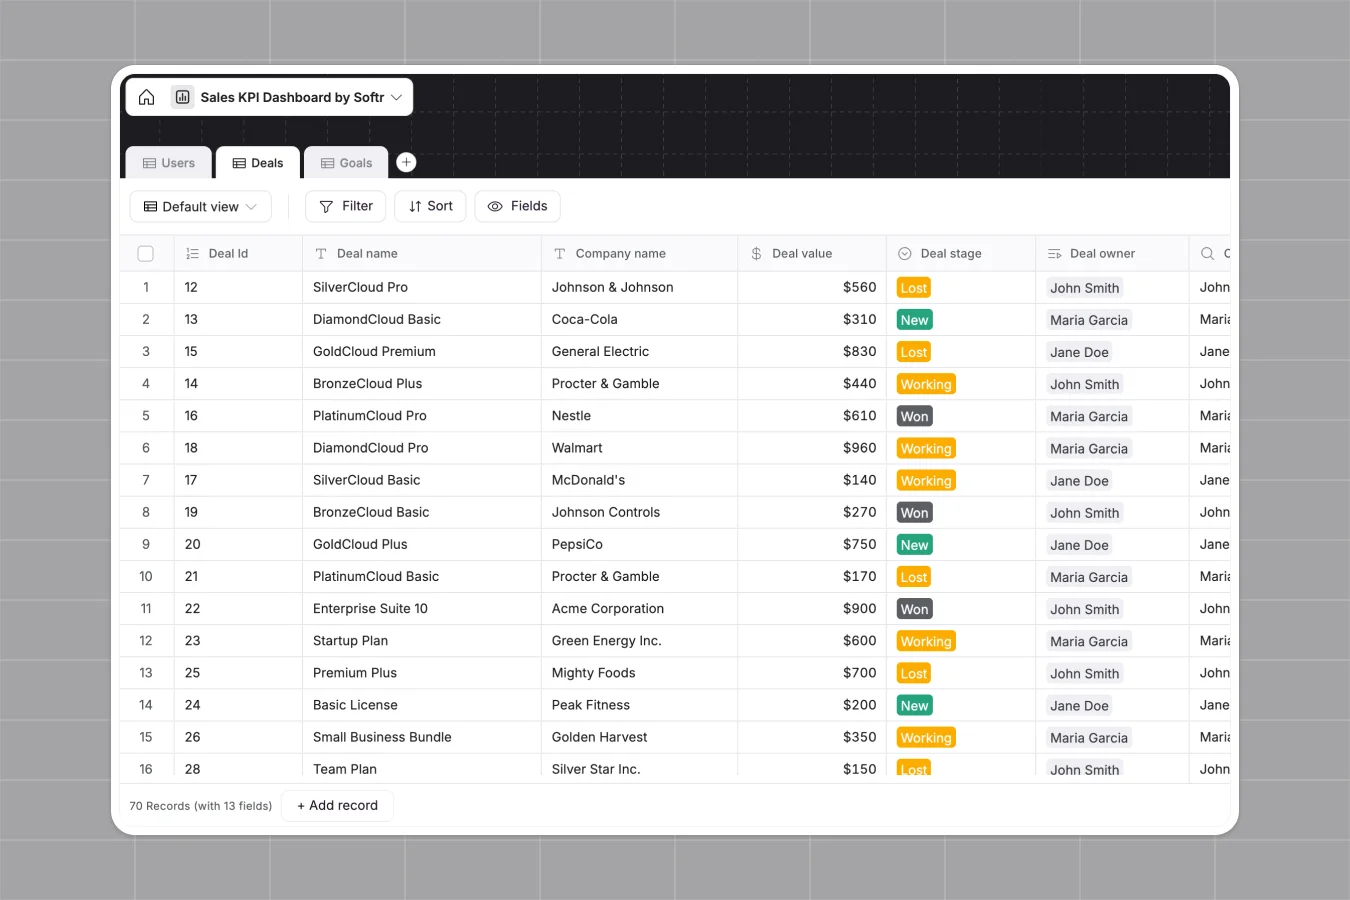
It organizes your data into three connected tables: Users, Deals, and Goals. When a sales rep updates a deal to a new stage, it instantly links back to their performance targets so goal attainment stays perfectly accurate.
Why tracking sales KPIs gets messy in Google Sheets
As your sales team grows, logging every deal, owner, and stage in a spreadsheet quickly becomes a chaotic mess of broken VLOOKUPs.
What a structured database changes
A structured database enforces clear rules, meaning revenue values stay as numbers and statuses lock to specific deal stages. You'll never lose data because someone accidentally pasted text into a date column.
Instead of fragile calculation formulas connecting reps to their quotas, tables link together natively. This is exactly what Softr Databases are designed for.
What you can do with this template
You can easily assign specific deals to sales reps and automatically calculate their precise percentage of goal attainment. Built-in formulas effortlessly track the created and closed months for every pipeline item.
This system comes completely ready to use immediately. Just copy it into your workspace, adjust the dropdown options for deal stages, and start managing your company revenue.
-
Users
Manage sales staff profiles with roles and link to performance targets
-
Deals
Track sales opportunities with values, stages, and ownership timelines
-
Goals
Monitor sales targets and calculate percentage of objective attainment
Who is this Sales KPIs Dashboard database for
This database offers a reliable, scalable way for teams to monitor their complete sales pipeline.
- Sales Managers: Track overall pipeline health, monitor daily rep performance, and spot revenue gaps early.
- Sales Representatives: Keep a close eye on individual goal attainment and manage assigned deals easily.
- Founders and Operators: Get a clean, high-level view of company revenue growth without complex CRM setup.
How to take it further
Customize the database
You can easily modify the pre-built deal stages to match your exact sales workflow or playbook. As a native database, adding new custom columns for client industries or win probabilities takes just a few clicks.
Import your existing data
If your historical pipeline is stuck in a CSV, simply import it directly into the Deals table to bring everything up to speed instantly. You can also use our API to automatically sync your revenue data with other tools.
Build a full app around it
When your team is ready, you can use the interface builder to turn this database into a secure internal portal. Sales reps can log into their own personalized dashboard to update deals and view current goal attainment.
Softr lets you set exact users and permissions to ensure managers see the whole pipeline while reps only view their own accounts. Starting with a properly structured data foundation makes building this custom app incredibly fast.
-
1
-
2
-
3
-
4
Frequently asked questions
-
What is a Sales KPIs Dashboard database?
-
Why use a no-code database to build a sales tracking tool?
-
How can AI help managing data for sales pipelines?
-
Can I build an app with this Sales KPIs Dashboard database?
-
Is this Sales KPIs Dashboard database free?
-
How is this database different from Google Sheets or Excel?
Start building today. It's free!
Build and launch your first app in under 30 minutes.