


Build your social media analytics dashboard
Track engagement, visualize reach, and share reports in an AI-powered dashboard built with AI to fit your agency's exact workflow.


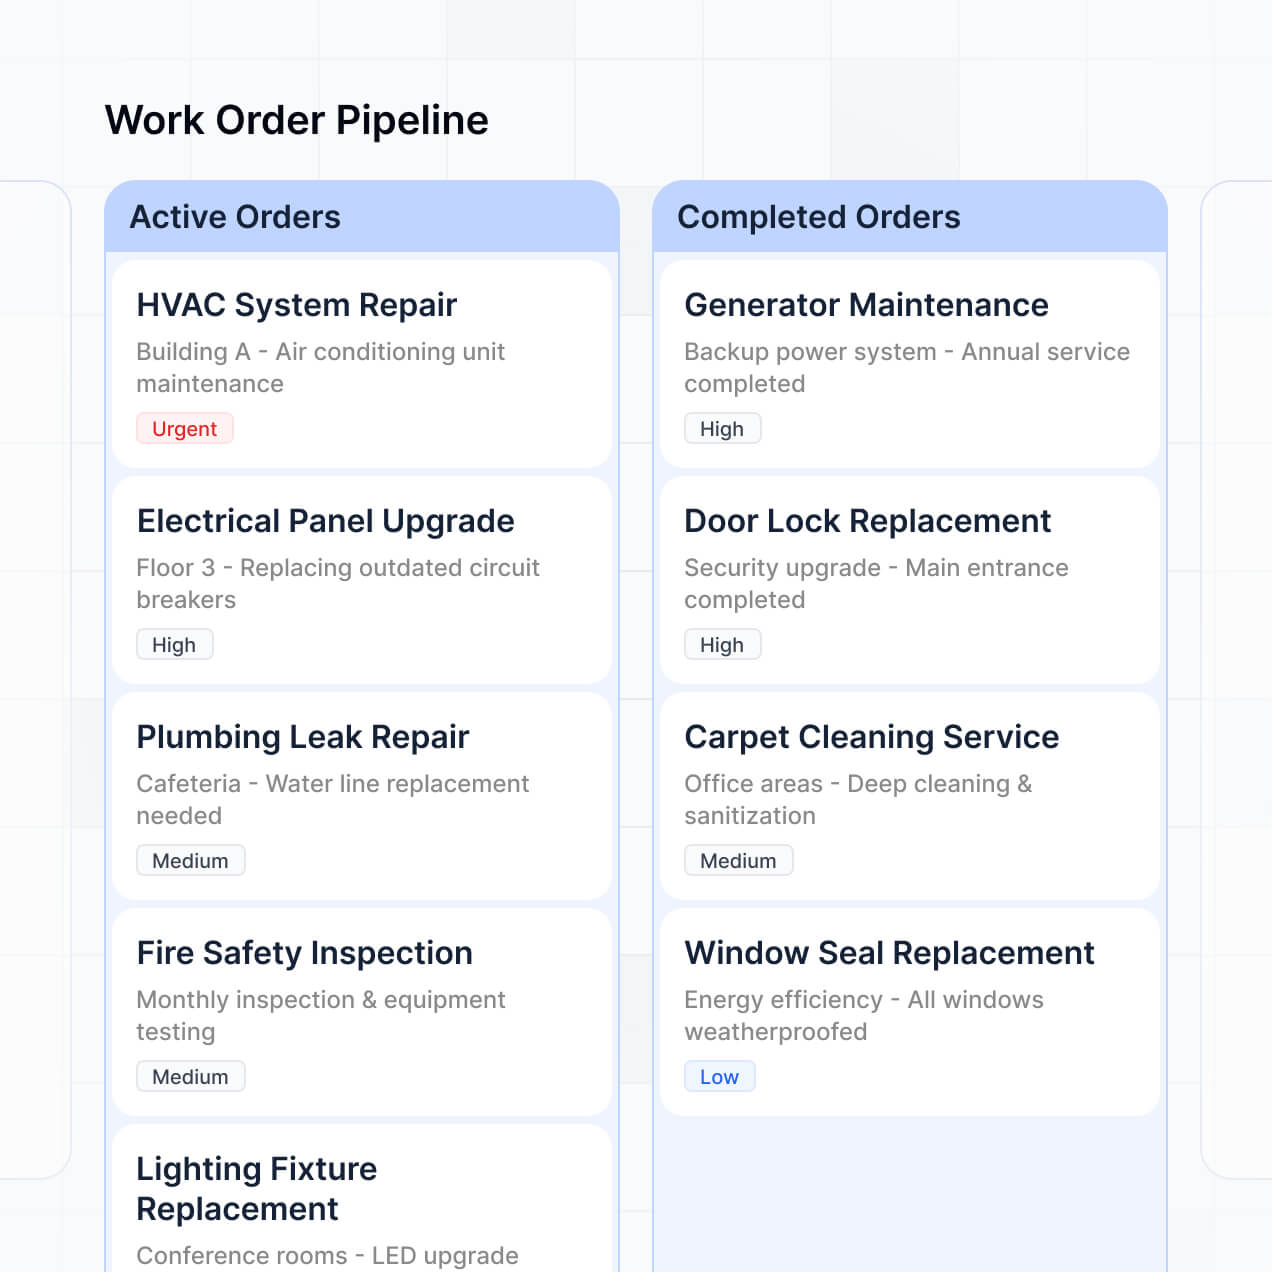
Build exactly what your team needs
Customize a social media analytics dashboard that looks sleek out of the box. Add only the filters and views you need to track your campaigns.
Centralized platform performance tracking
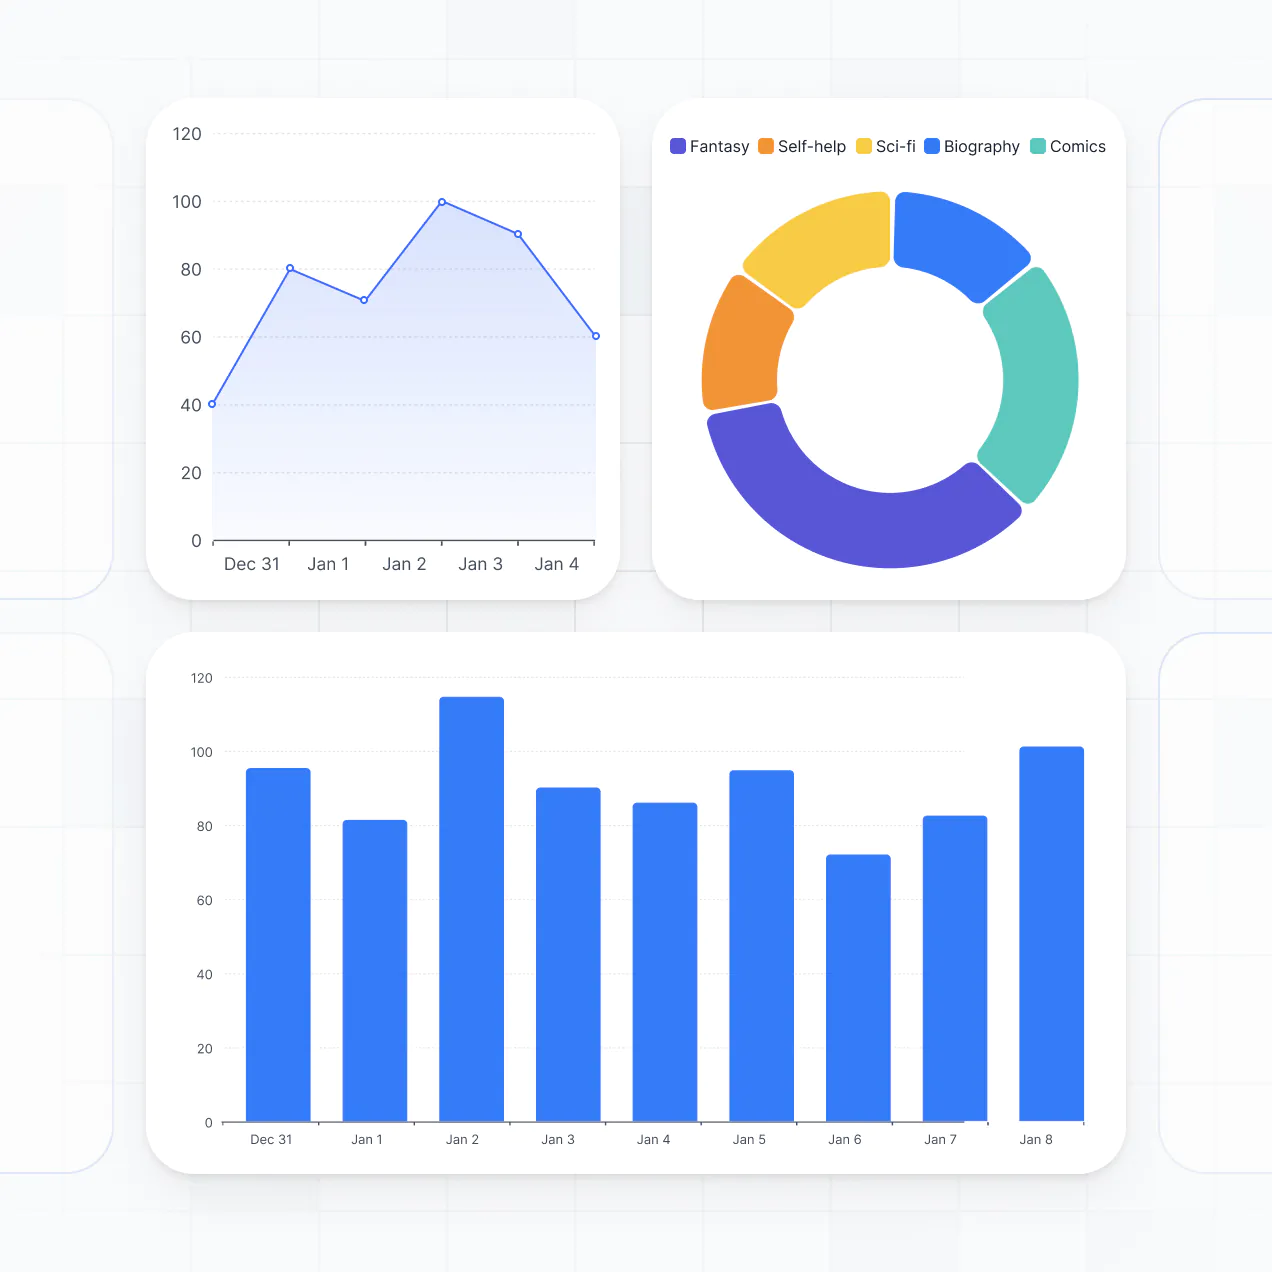
AI-powered engagement insights
Automated weekly report distribution
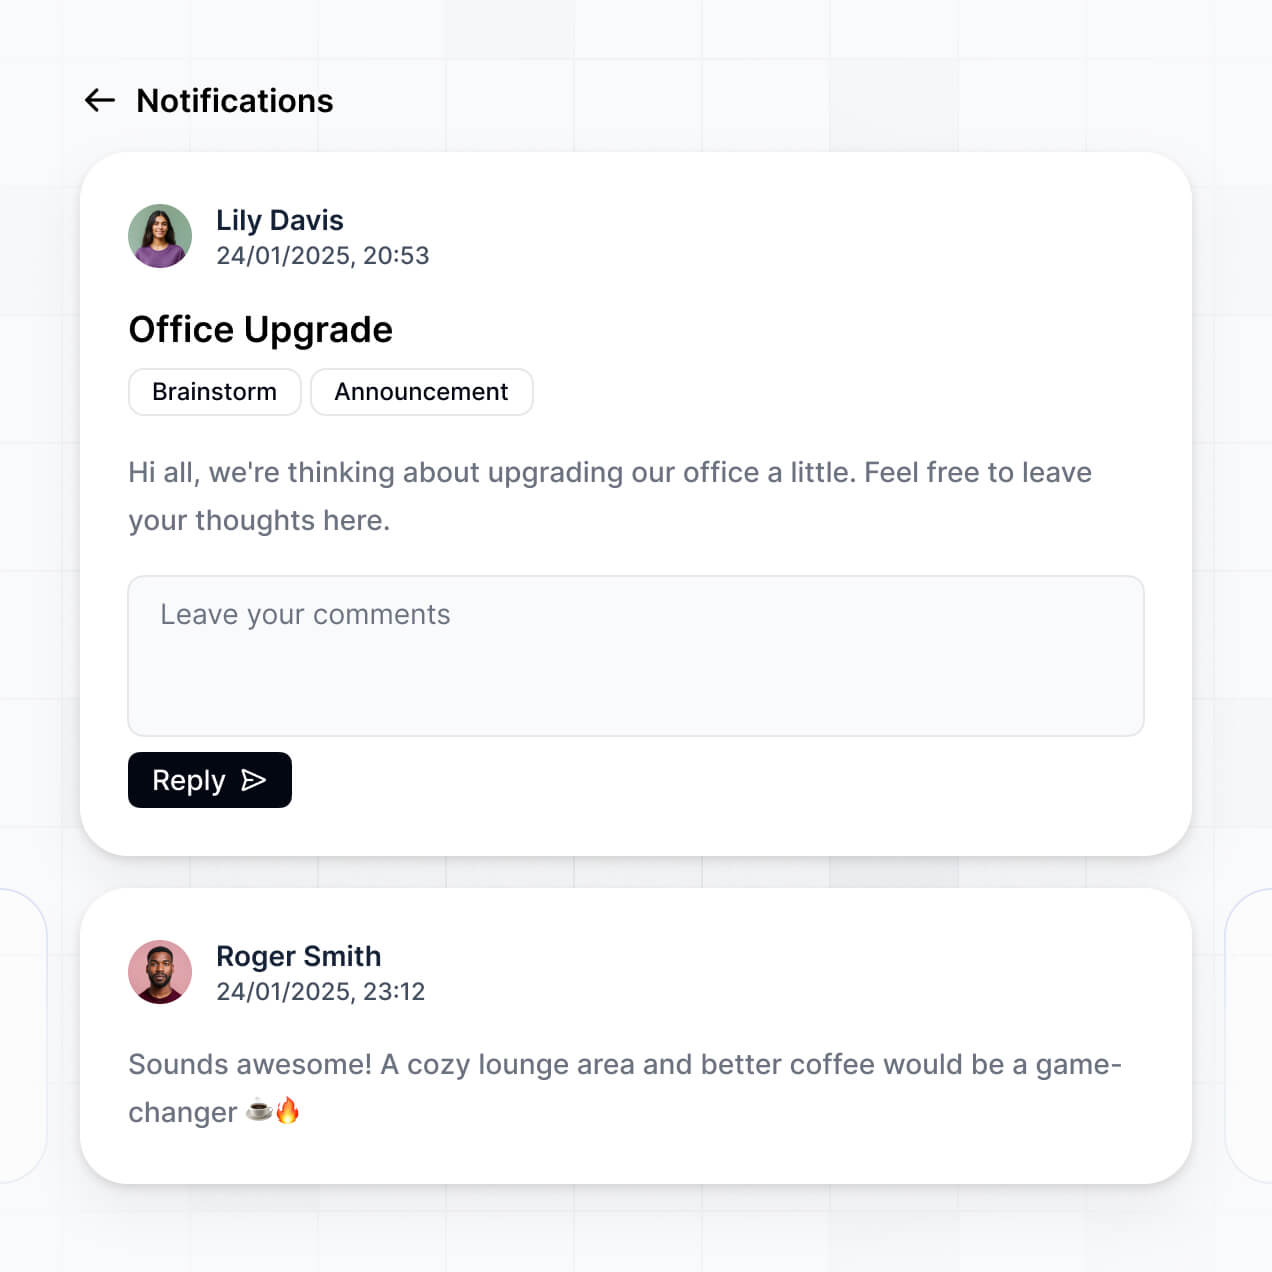
Custom campaign tagging system
Client-facing report portals
Competitive benchmark analysis

Unify your performance data in real time
Connect spreadsheets and marketing tools with real-time sync—or manage everything in Softr Databases. Create a single source of truth for your social media performance data.


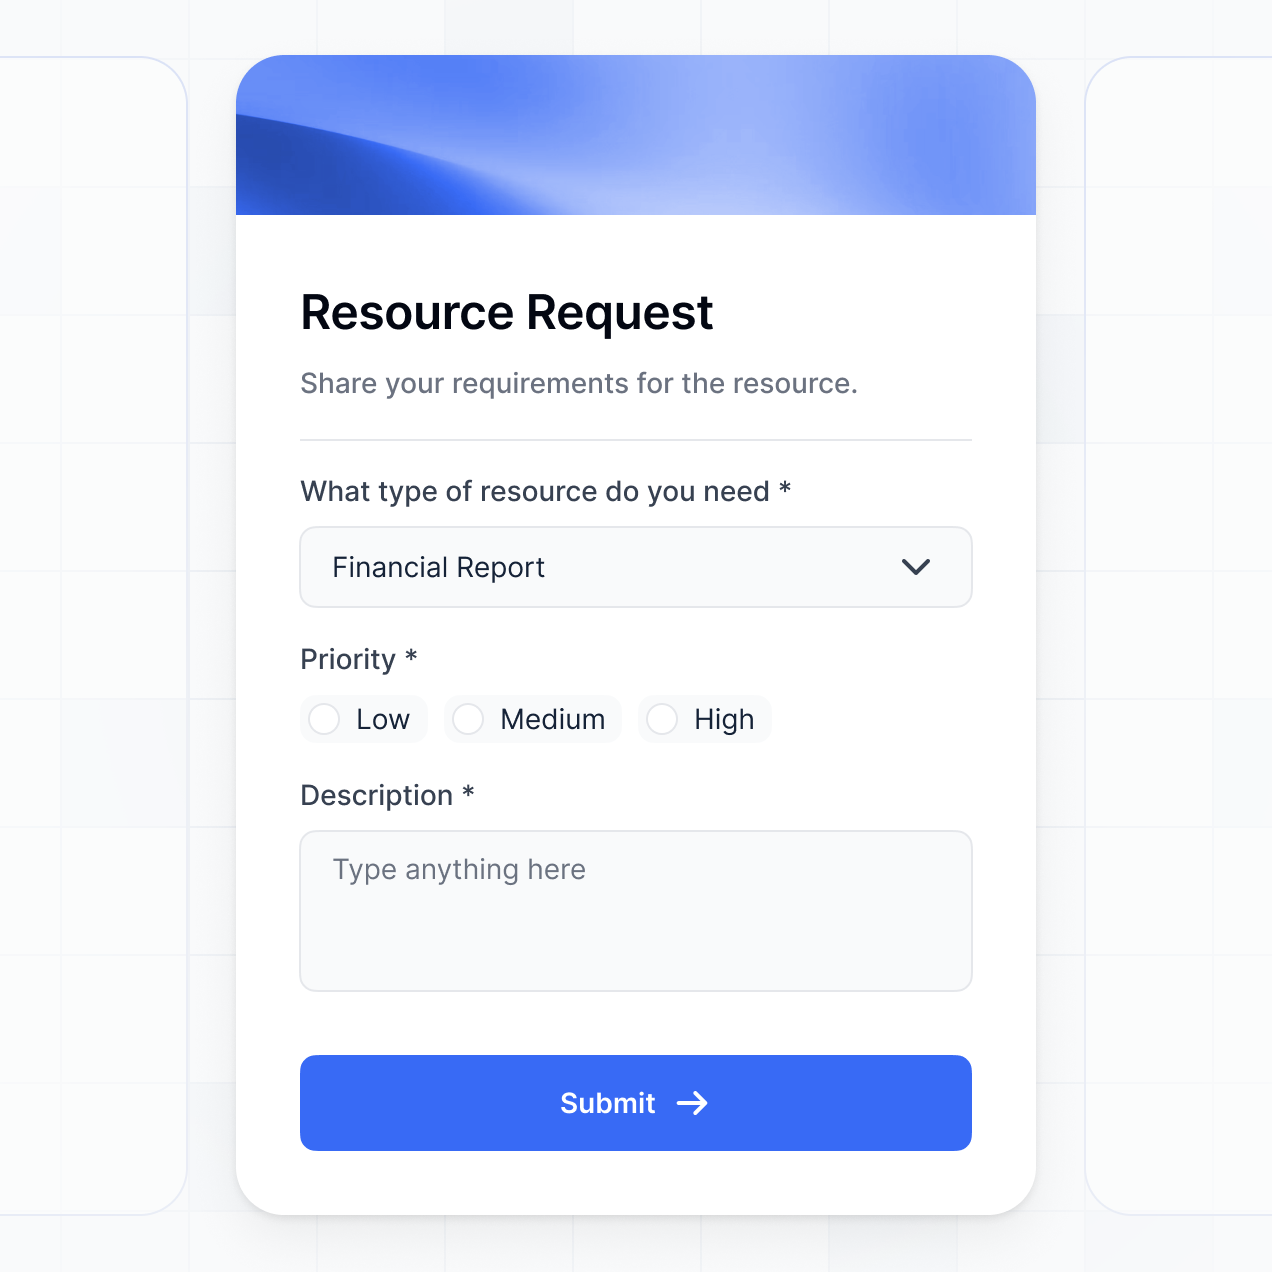
Give every user a custom, secure experience.
Give each client and manager the right views and access in a branded portal. Set up secure logins, user groups, and permissions in minutes.

Easy, secure logins
Your dashboard is mobile-ready by default. Turn it into a downloadable app so clients can check their metrics on the go.

Works on any device
Your dashboard is mobile-ready by default. Turn it into a downloadable app so clients can check their metrics on the go.

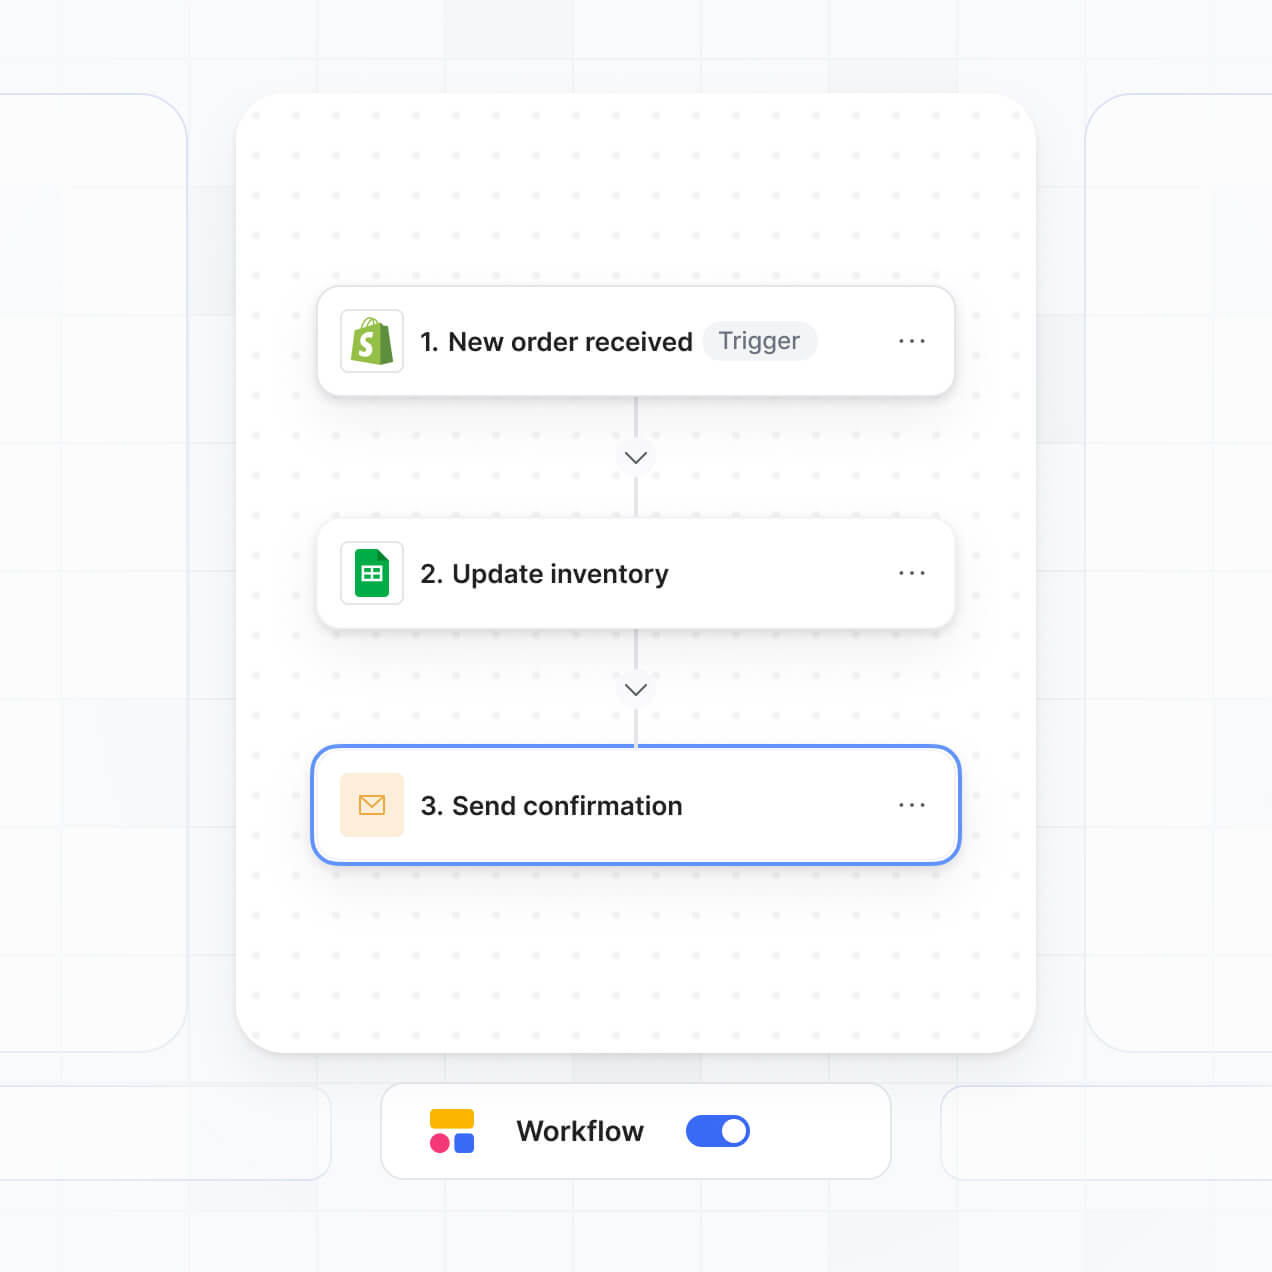
Automations
Build native automations to handle weekly report notifications and data alerts whenever your campaign performance changes.

User groups
Provide separate logins for different clients so they only see their own campaign data and analytics dashboards.

Advanced permissions
Apply rules for different roles. Customize who can view raw data, edit benchmarks, or export reports at a granular level.

Security
Protect sensitive marketing information and client data. Softr is fully compliant with SOC2 and GDPR regulations.

Why Softr vs other software
No more one-size-fits-all tools or costly custom builds. Softr is easy to use and fully customizable, so you can launch faster, adapt as you grow, and skip the complexity of traditional software.

Easy, fast setup
Build your social media analytics dashboard in minutes with AI—no manual configuration needed.

Consolidate your stack
Add features like campaign tagging, client portals, or automated insights as your analytics needs evolve.

Flexible as you grow
Start with a dashboard, then add reporting tools and team forms—all in one place, with no extra tools.
Generate a custom social media analytics dashboard
Co-build with AI
Simply describe what you need. Let Softr handle everything - Interface, database, workflows.
Iterate with AI or visually
Control most critical parts of your app yourself - roles, permissions, security.
Ship the same day
Invite team members or external clients and partners right away. No developer handover.

The go-to platform for business operations
Use drag-and-drop blocks to build a portal that looks sleek and modern out of the box. Add only the features you need, and iterate as your workflows evolve.


Minerva Network increased athlete registrations by 50% with a custom CRM and portal

Celonis built a GTM knowledge base for 1,500+ team members
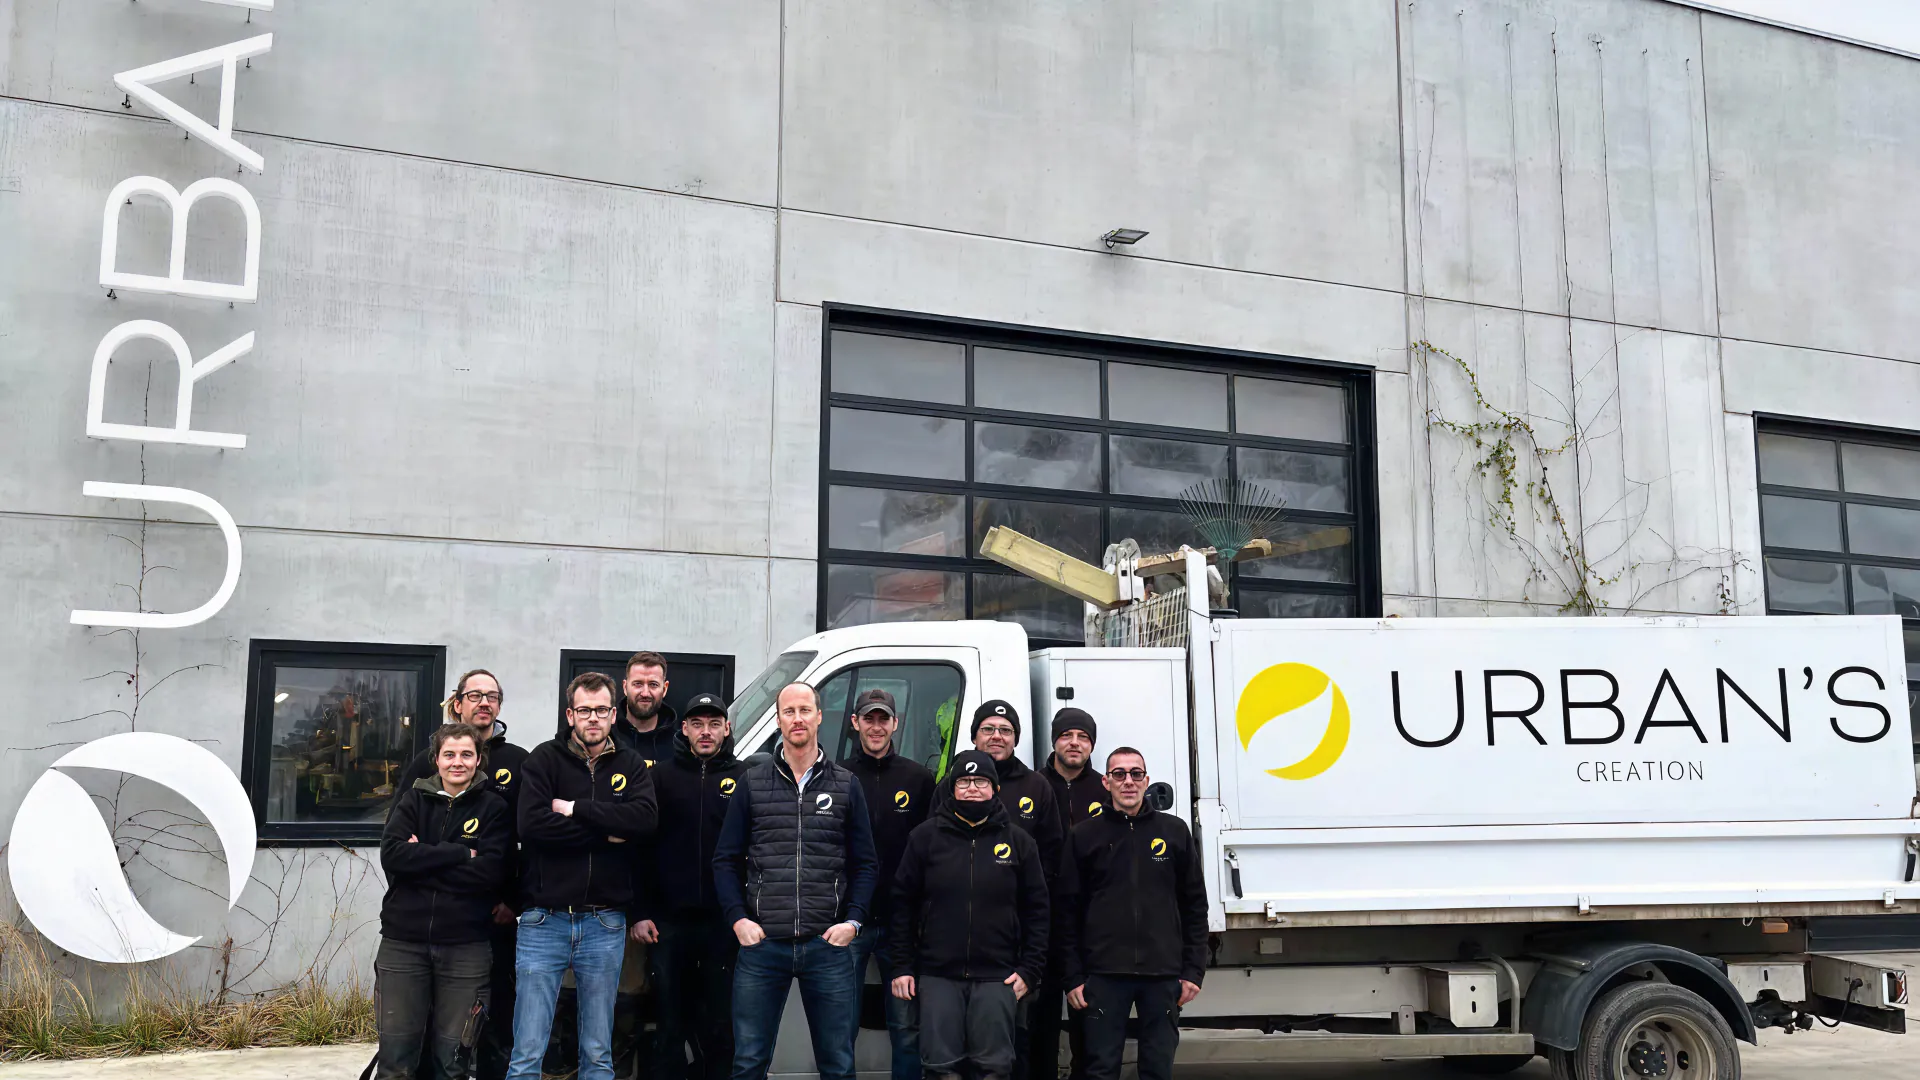
Urban's Group increased productivity by 25% with a custom ERP system
Frequently asked questions
Build your social media analytics dashboard
Describe what you need. Softr's AI builds your dashboard and reporting suite in minutes.